
Measuring Urban Change
Neighborhood environments play a significant role in shaping the health of individuals and communities, consequently contributing to inequality in the U.S. However, studies on cities and neighborhoods have been constrained in part by limited data and methods for capturing characteristics of residential contexts and their changes. Researchers typically rely on surveys of demographic and housing characteristics that are measured at infrequent intervals and are only available at administratively defined spatial aggregations like census tracts (e.g., decennial U.S. Census). These projects draw on innovative data--including Google Street View imagery and residents’ cognitive maps--and methodological approaches--including crowdsourcing and deep machine learning--to capture various aspects of urban environments and change. We also focus specifically on ways to measure gentrification, exploring the ways it has been measured in past research and comparing new alternative approaches.
‘Seeing’ Spatial Contexts at Scale
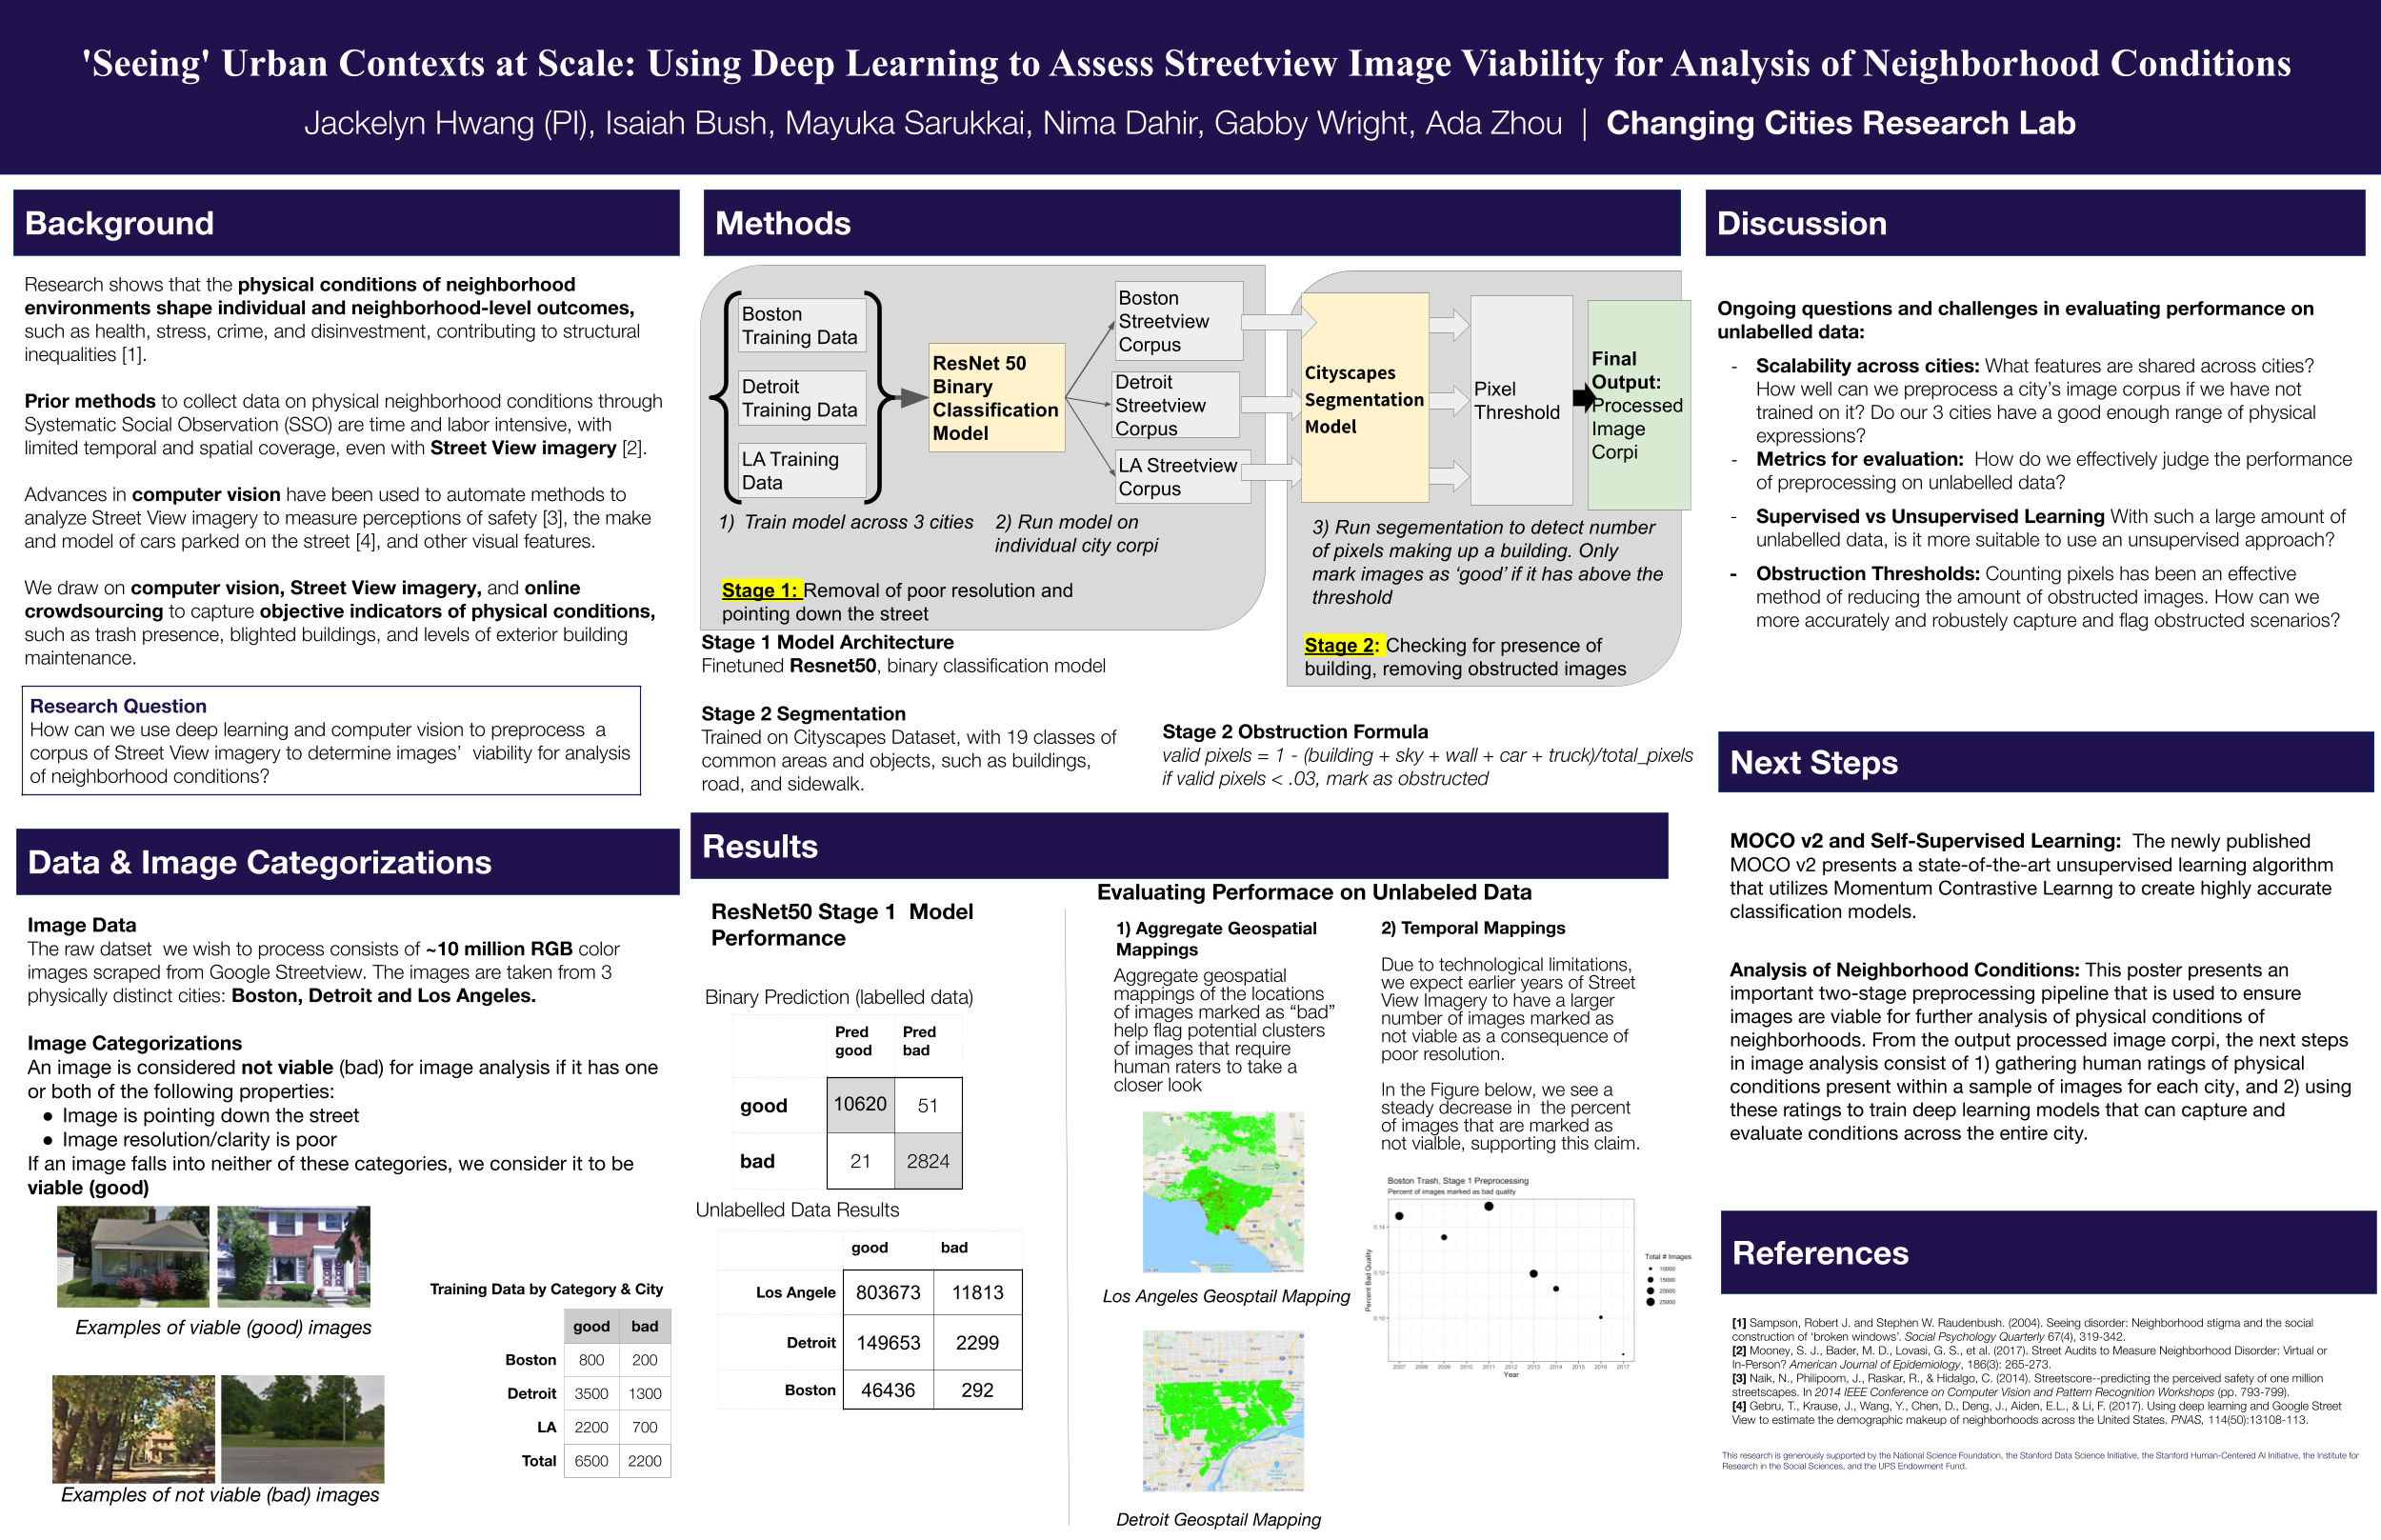
A CCRL poster presentation summarizing the project.
Past research suggests that the presence of physical disorder, poorly maintained properties, and vacant lots in neighborhoods can negatively affect physical and mental health, attract more crime and disorder, and lead to neighborhood disinvestment. Few studies, however, examine this process because collecting data on the physical conditions of neighborhoods, especially across neighborhoods and cities and over time, requires extensive time and labor costs. This project develops an automated method to systematically observe and record the physical conditions of neighborhood environments at a large-scale using street view imagery, crowdsourcing, and convolutional neural networks.
Academic Publications: Fine-Grained Assessment of Urban Change with Street View Time Series (AAAI Conference on Artificial Intelligence, 2024), Curating Training Data for Reliable Large-Scale Visual Data Analysis: Lessons from Identifying Trash in Street View Imagery (Sociological Methods & Research, 2023), Systematic Social Observation at Scale: Using Crowdsourcing and Computer Vision to Measure Visible Neighborhood Conditions (Sociological Methodology, 2023),
Funders: Stanford Woods Institute for the Environment, National Science Foundation, Stanford UPS, Stanford Artificial Intelligence Lab, Stanford Data Science Initiative, 2018-2019, Stanford Institute for Research in the Social Sciences
New Ways to Capture Urban Change
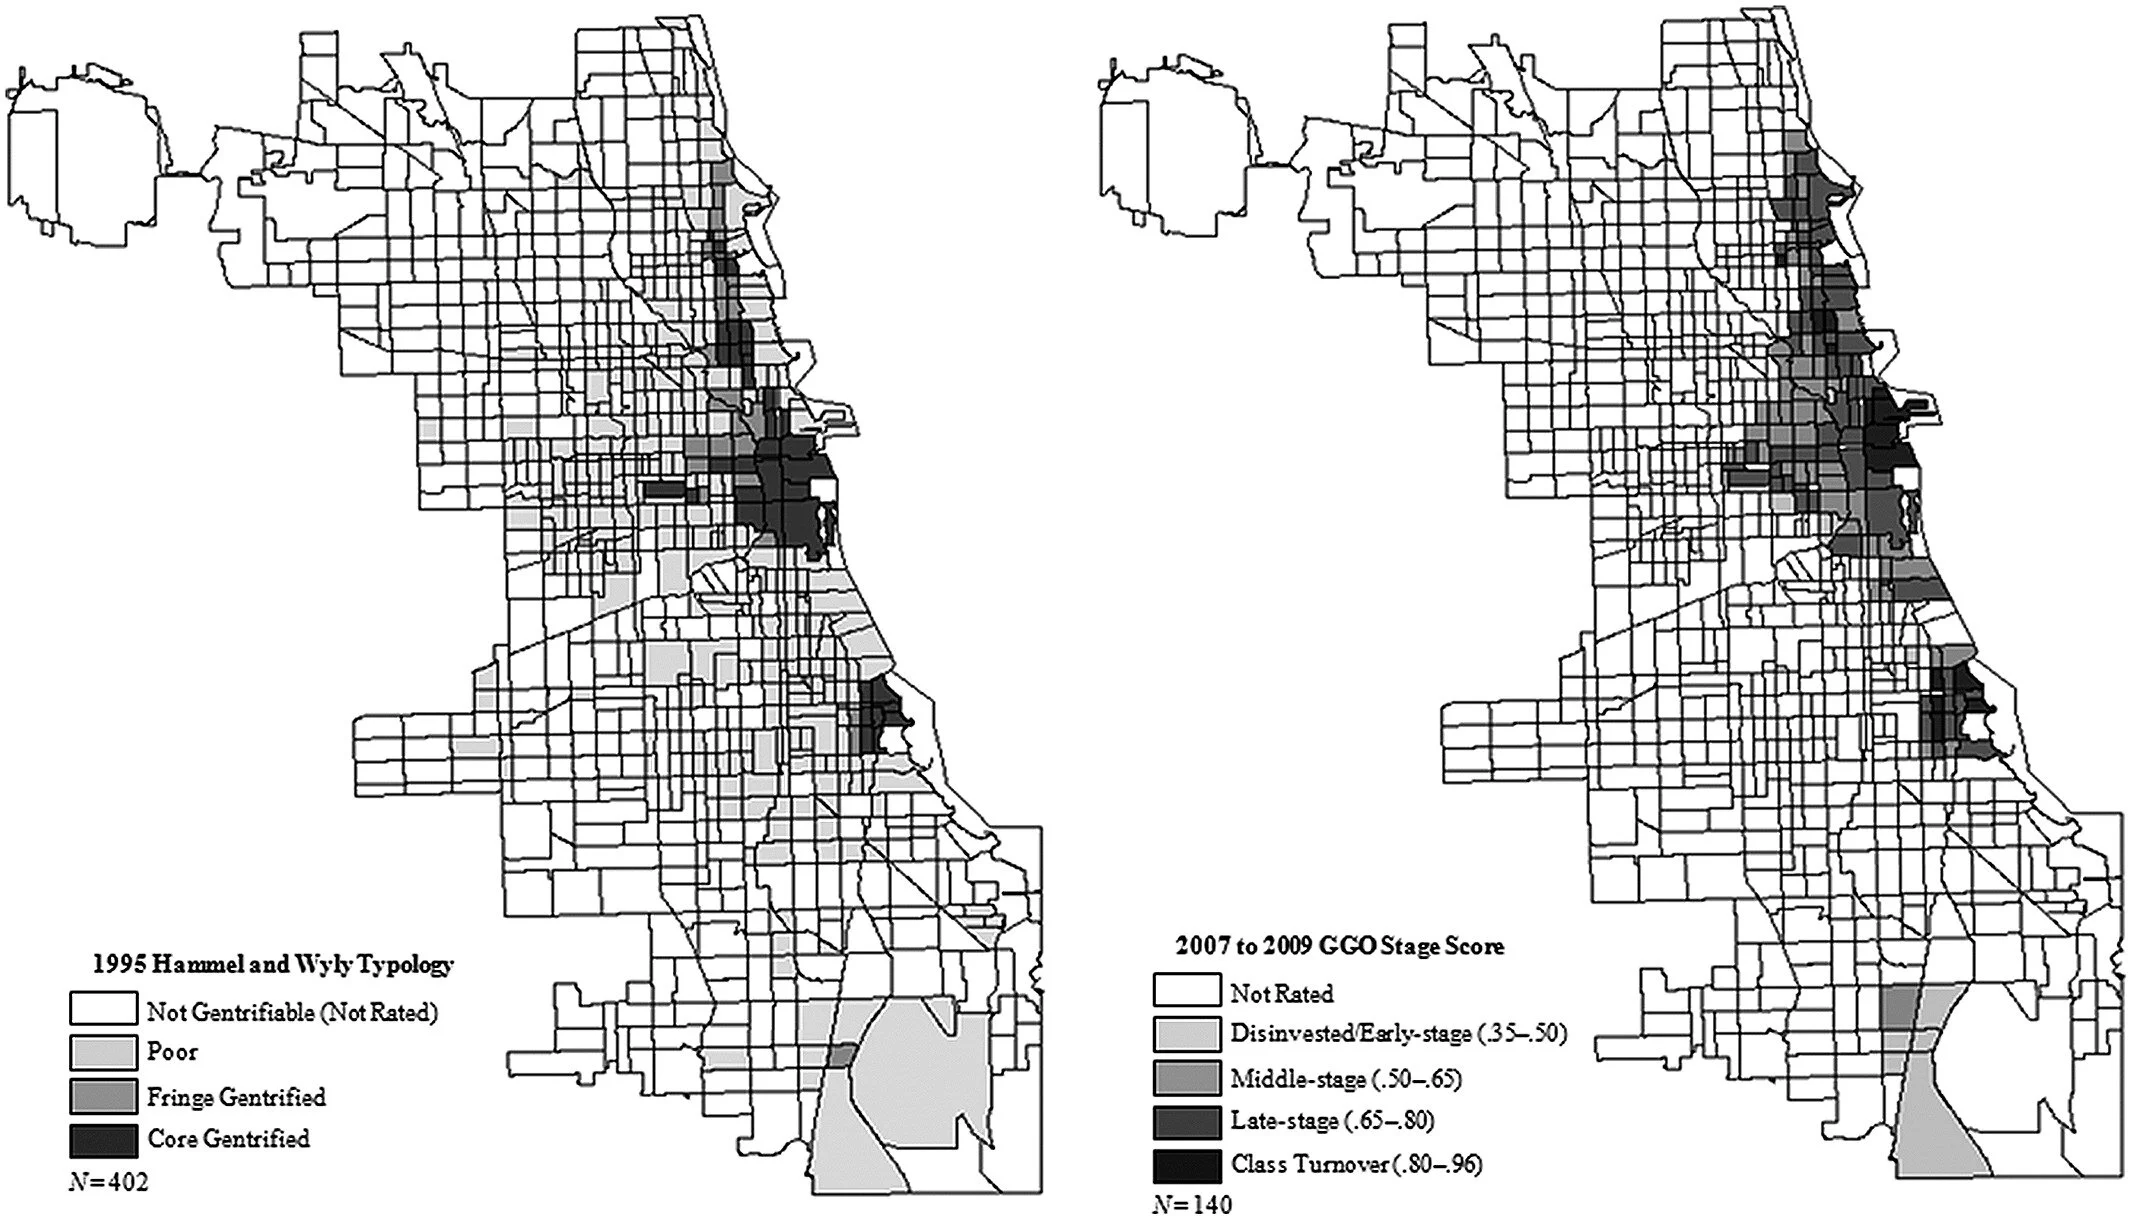
Two census-tract level maps of Chicago comparing Hammel and Wyly gentrification typology in 1995 to Google Street View 2007-2009 Gentrification Observation scores. Source: Divergent Pathways (2014).
Researchers typically rely on publicly available administrative data like the U.S. Census and American Community Surveys to capture urban change. These data are publicly available at predefined spatial aggregations, like census tracts, and at less than ideal time intervals (e.g., every 10 years or 5-year estimates). How well do predefined spatial aggregations capture how residents define their neighborhoods when they’re undergoing change? Do visible conditions of neighborhoods, as seen through Google Street View imagery, capture distinct characteristics of residential contexts that are not well-documented in typical data sources?
Academic Publications: Social Construction of a Gentrifying Neighborhood (Urban. Aff. Rev., 2016), Gentrification in Changing Cities (Ann. Am. Acad. Polit. SS., 2015), Divergent Pathways of Gentrification (Am. Sociol. Rev., 2014)
Selected Media Coverage: 99% Invisible, Bloomberg CityLab (here and here), The Boston Globe, Chicago Magazine, Gizmodo, The New Yorker, Next City, NPR Code Switch, Slate.com, The Wall Street Journal, WHYY
Public Engagement: Divergent Pathways Summary (blog post, 2014)
Data: The Google Street View Gentrification Observations (GGO) are part of a data collection effort to systematically observe the physical conditions of neighborhoods. Google Street View is a free and fully accessible tool to the public that provides the virtual experience of walking down the street and permits the direct examination of the complex and qualitative nature of gentrification, going beyond traditional quantitative measures from the U.S. Census.
The coding guides used for GGO data collection are intended to assess the level of reinvestment, renewal, and influx of middle- and upper-middle-class residents in previously disinvested and declined neighborhoods. The coding guides contain the survey instrument, coding procedure details, and examples. The coding guide used for our study on Divergent Pathways of Gentrification (2014) can be found here. The coding guide used for data collection efforts in Chicago and Seattle (2015) can be found here.
A Flexible Approach to Measuring Gentrification
Gentrification scholars lack a consensus on the best way to measure gentrification using administrative data, especially across different cities and regions. This project examines the various ways that gentrification has been measured using Census and American Community Survey data in past research, compares alternative approaches, and proposes a flexible framework for guiding scholars in developing quantitative measures of gentrification.
Publications & Data
Academic Publications
Huang, Tianyuan, Zeija Woo, Jiajun Wu, Jackelyn Hwang, and Ram Rajagopol. 2024. “CityPulse: Fine-Grained Assessment of Urban Change with Street View Time Series.” In the Proceedings for the 38th AAAI Conference on Artificial Intelligence. 2024 Feb 22-25. Vancouver, Canada.
Hwang, Jackelyn, and Nikhil Naik. 2023. “Systematic Social Observation at Scale: Using Crowdsourcing and Computer Vision to Measure Visible Neighborhood Conditions.” Sociological Methodology, 53(2), 183-216.
Hwang, Jackelyn, Nima Dahir, Mayuka Sarukkai, and Gabby Wright. 2023. “Curating Training Data for Reliable Large-Scale Visual Data Analysis: Lessons from Identifying Trash in Street View Imagery.” Sociological Methods & Research, 52(3), 1155-1200.
Hwang, Jackelyn. 2016. “The Social Construction of a Gentrifying Neighborhood: Reifying and Redefining Identity and Boundaries in Inequality.” Urban Affairs Review, 52(1): 98-128. [Preprint]
Hwang, Jackelyn. 2015. “Gentrification in Changing Cities: Immigration, New Diversity, and Racial Inequality in Neighborhood Renewal.” The ANNALS of the American Academy of Political and Social Science, 660(1):319-340. [Preprint, Coding guide]
Hwang, Jackelyn and Robert J. Sampson. 2014. “Divergent Pathways of Gentrification: Racial Inequality and the Social Order of Renewal in Chicago Neighborhoods.” American Sociological Review, 79(4): 726-51. [Preprint]
Public Engagement
Hwang, Jackelyn and Robert J. Sampson. (2014 July 9). “Google Street View shows that gentrification in Chicago has largely bypassed poor minority neighborhoods, reinforcing urban inequality.” USAPP—American Politics and Policy Blog. London School of Economics.
Data
The Google Street View Gentrification Observations (GGO) are part of a data collection effort to systematically observe the physical conditions of neighborhoods. Google Street View is a free and fully accessible tool to the public that provides the virtual experience of walking down the street and permits the direct examination of the complex and qualitative nature of gentrification, going beyond traditional quantitative measures from the U.S. Census.
The coding guides used for GGO data collection are intended to assess the level of reinvestment, renewal, and influx of middle- and upper-middle-class residents in previously disinvested and declined neighborhoods. The coding guides contain the survey instrument, coding procedure details, and examples. The coding guide used for our study on Divergent Pathways of Gentrification (2014) can be found here. The coding guide used for data collection efforts in Chicago and Seattle (2015) can be found here.
In an effort to make our findings accessible, where possible, we provide a link to preprint versions of our publications. We are also steadily assembling our data and code to share publicly when possible.