

Oakland Vignette Series: Trends in Moving
Changing Cities Research Lab
Contributors: Jackelyn Hwang, Vineet Gupta, Alisha Zhao, Becky Liang, and Vasudha Kumar
September 6, 2021
This is the first post in our series of Data Vignettes on Residential Instability in Oakland. Navigate to other posts in this series here.
The Changing Cities Research Lab at Stanford University partnered with the City of Oakland’s Department of Housing and Community Development (HCD) and the Federal Reserve Bank of San Francisco’s Community Development Department to study residential instability, resulting from increasing gentrification and decreasing housing affordability, in the City of Oakland over the last two decades. We leveraged data on mobility and financial health from 2002-2020 from the Federal Reserve Bank of New York’s Consumer Credit Panel/Equifax and administrative data on housing from the City of Oakland and Alameda County. In our analyses, we examined not only formal and informal forms of displacement, like evictions, foreclosures, and moving, but also invisible forms of residential instability before residents ever face displacement (e.g., financial instability, crowding) and where residents moved.
We recently published our findings in two reports: Neighborhood Change and Residential Instability in Oakland1, and Residential and Neighborhood Instability in Oakland2.
Is gentrification displacing Oakland residents?
This is the first of a series of posts that highlight our findings showing how and where different Oakland communities have been affected. This post examines how much Oakland residents have moved over the last two decades, which varies across the socioeconomic status (SES) of residents and across Oakland neighborhoods. Note that this study uses Equifax Risk Scores, a type of credit score, as a proxy for SES. Therefore, it approximates financial stability rather than income or wealth.
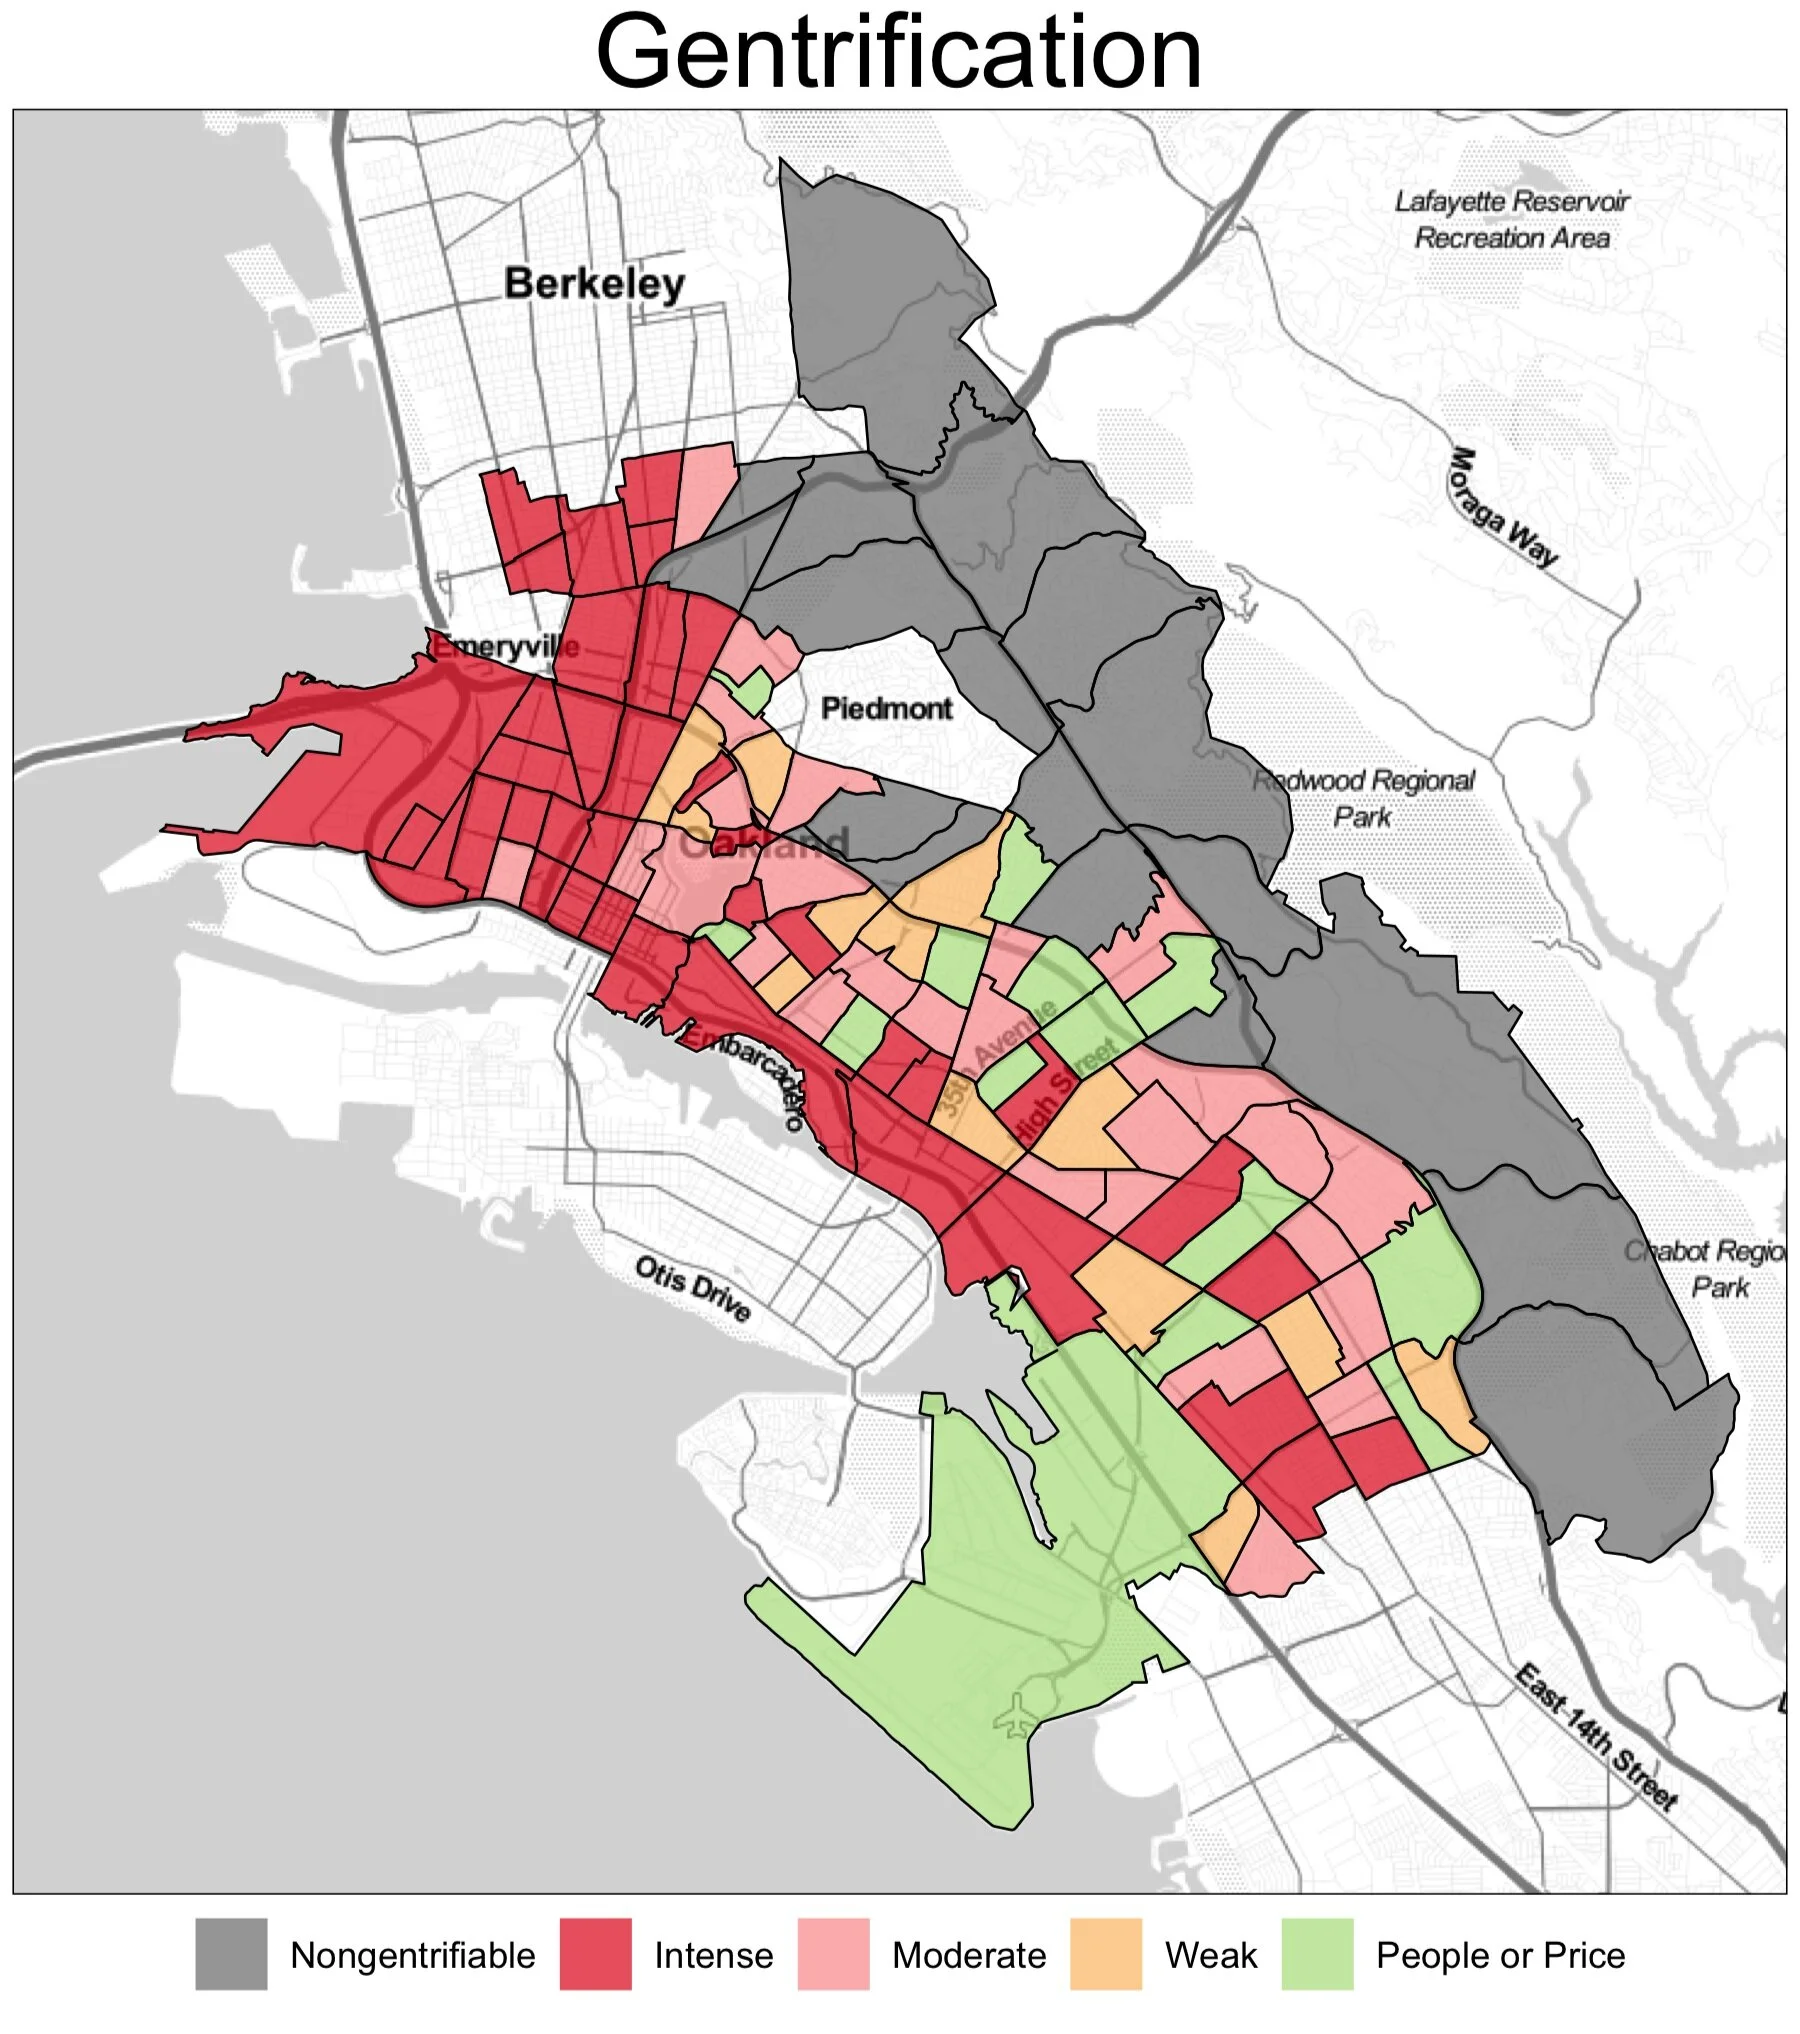
All neighborhoods that were gentrifiable in 2000 experienced substantial changes in socioeconomic and/or price increases.
Figure 1: Gentrification levels from 2000-2016, based on increases in college-educated or high-income residents and housing prices. Source: 2000 US Census, 2005-2009 ACS, and 2014-2018 ACS.
Over the last two decades, all neighborhoods in Oakland exhibited some signs of gentrification, characterized by the influx of higher-class residents and/or substantial increase in housing prices compared to changes in the rest of the East Bay (Figure 1). West Oakland and parts of Downtown Oakland and North Oakland experienced the largest increases in high-income or college-educated residents and housing prices (measured by rents and home values), categorized as “intense” gentrification. Many parts of East Oakland experienced smaller but still substantial changes.
Lower-SES residents (about two-thirds of Oaklanders, based on our studies’ SES categories) moved out of their neighborhoods at higher rates than residents in other neighborhoods from most of these intensely gentrifying areas but not all of them. Those who lived in Downtown and North Oakland moved at consistently higher rates than those in East Oakland and most of the Oakland Hills area (Figure 2). Over the two decades, moving rates in Downtown Oakland and parts of North Oakland remained consistently in the top two quintiles. Lower-SES residents increasingly moved out of Oakland altogether from these areas after the Great Recession (recovery and post-recovery periods)3, as affordable housing options became increasingly limited in the city.
Lower-SES residents consistently moved at higher rates out of neighborhoods in Downtown and North Oakland.
Figure 2: Percentage of people moving over time for lower-SES populations across Oakland census tracts, 2002-2018.
While about 75 percent of residents who move leave Oakland, the top destinations for movers across SES categories are generally nearby major cities, such as San Francisco, San Leandro, and Hayward. Nearly 50 percent of movers move elsewhere in the East Bay (Figure 3). The findings confirm the stories of what long-term Oaklanders have told on the ground: residents are being priced out of the current housing market to deeper parts of the East Bay4.
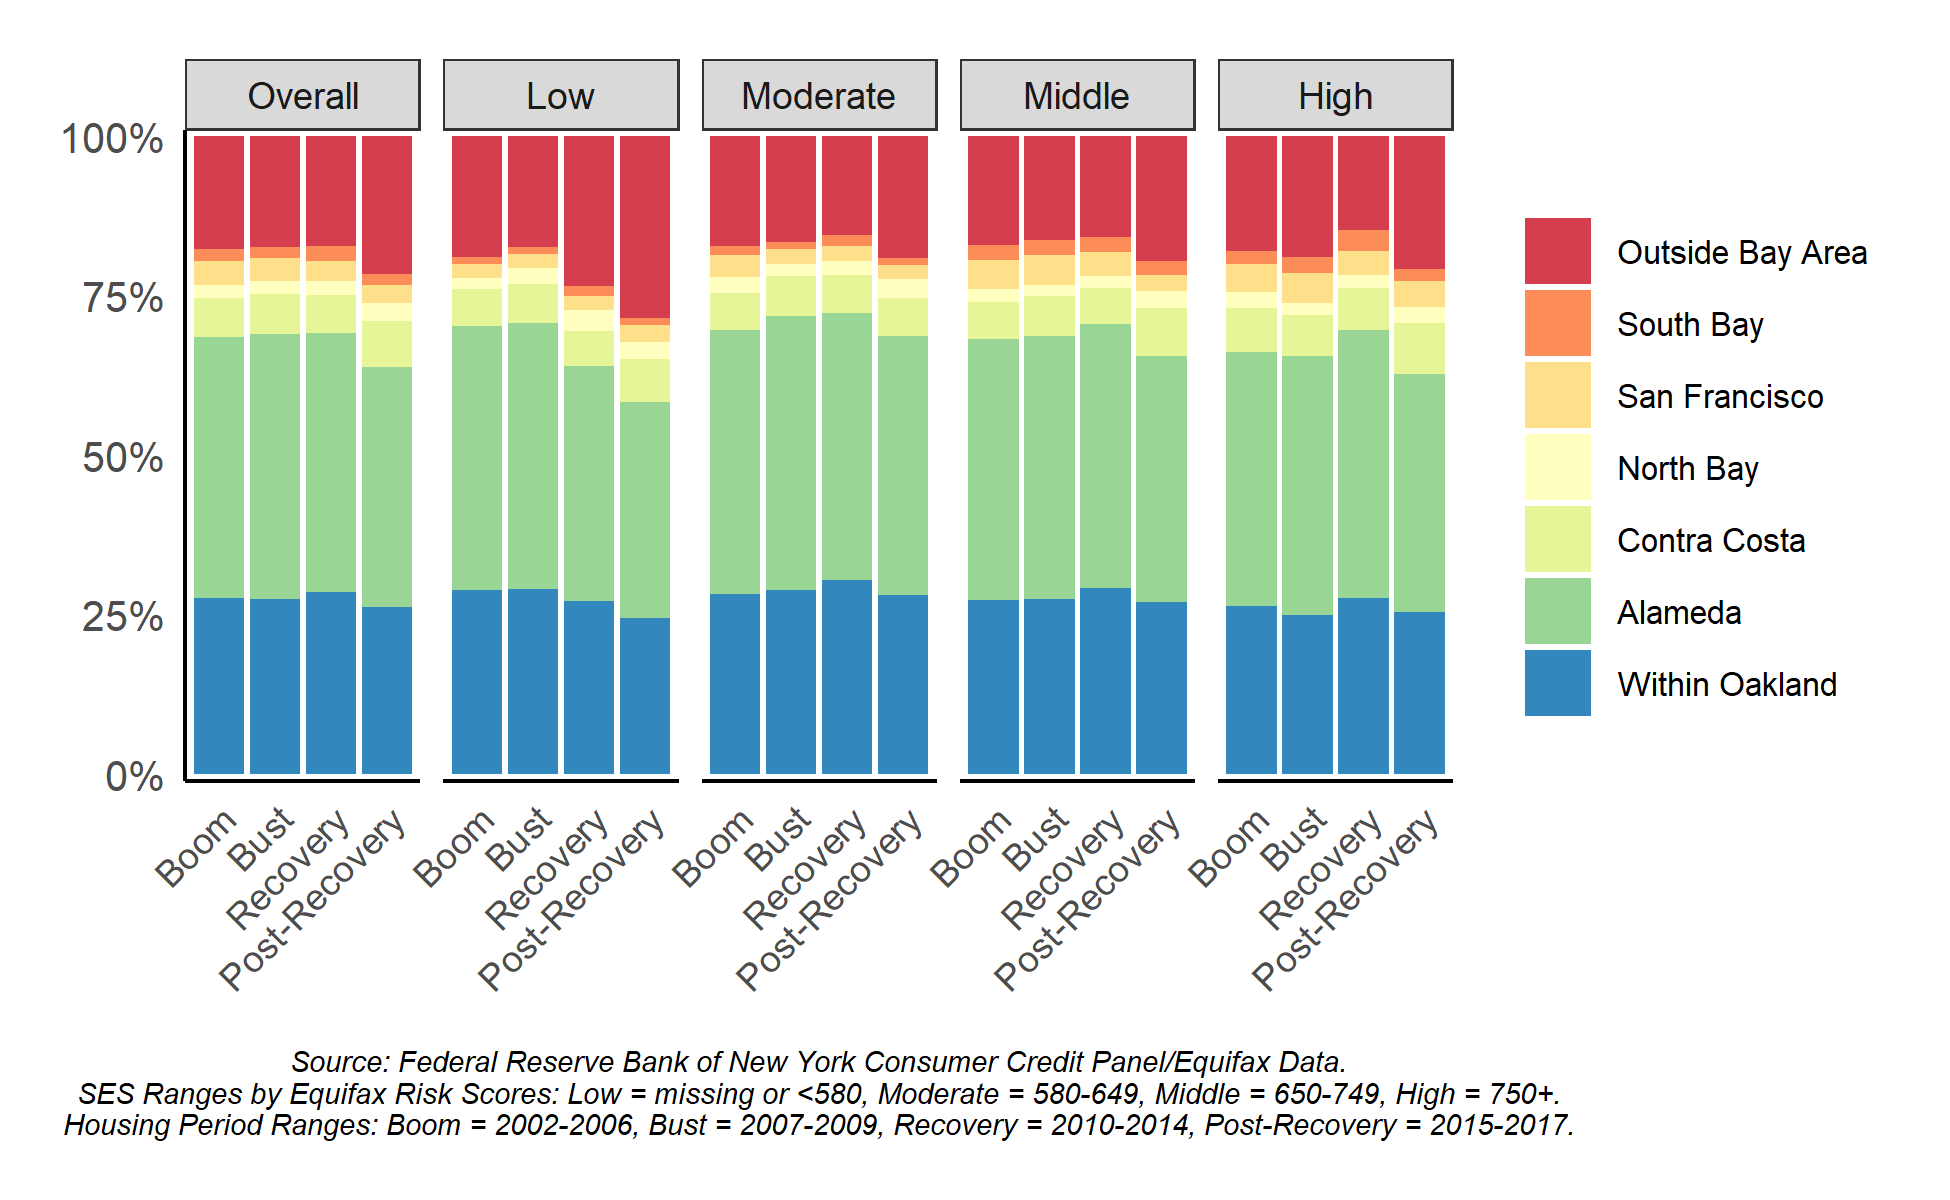
Across all periods and SES groups, most movers move to another part of Alameda County.
Figure 3: Where Oakland movers are going from 2002-2018, by SES.
The Oaklanders’ stories demonstrate the ongoing threat of residential displacement in Oakland, yet these trends are not new. In fact, Oakland residents across all SES groups moved more frequently before and during the Great Recession (Figure 4). These high rates of moving may be due to forces that pushed residents to new places, such as the proliferation of subprime lending, as well as foreclosures and financial insecurity brought on by the economic fallout. Following the Recession, Oakland residents moved much less than before. Nonetheless, lower-SES residents consistently moved at or above national rates (around 12 percent).
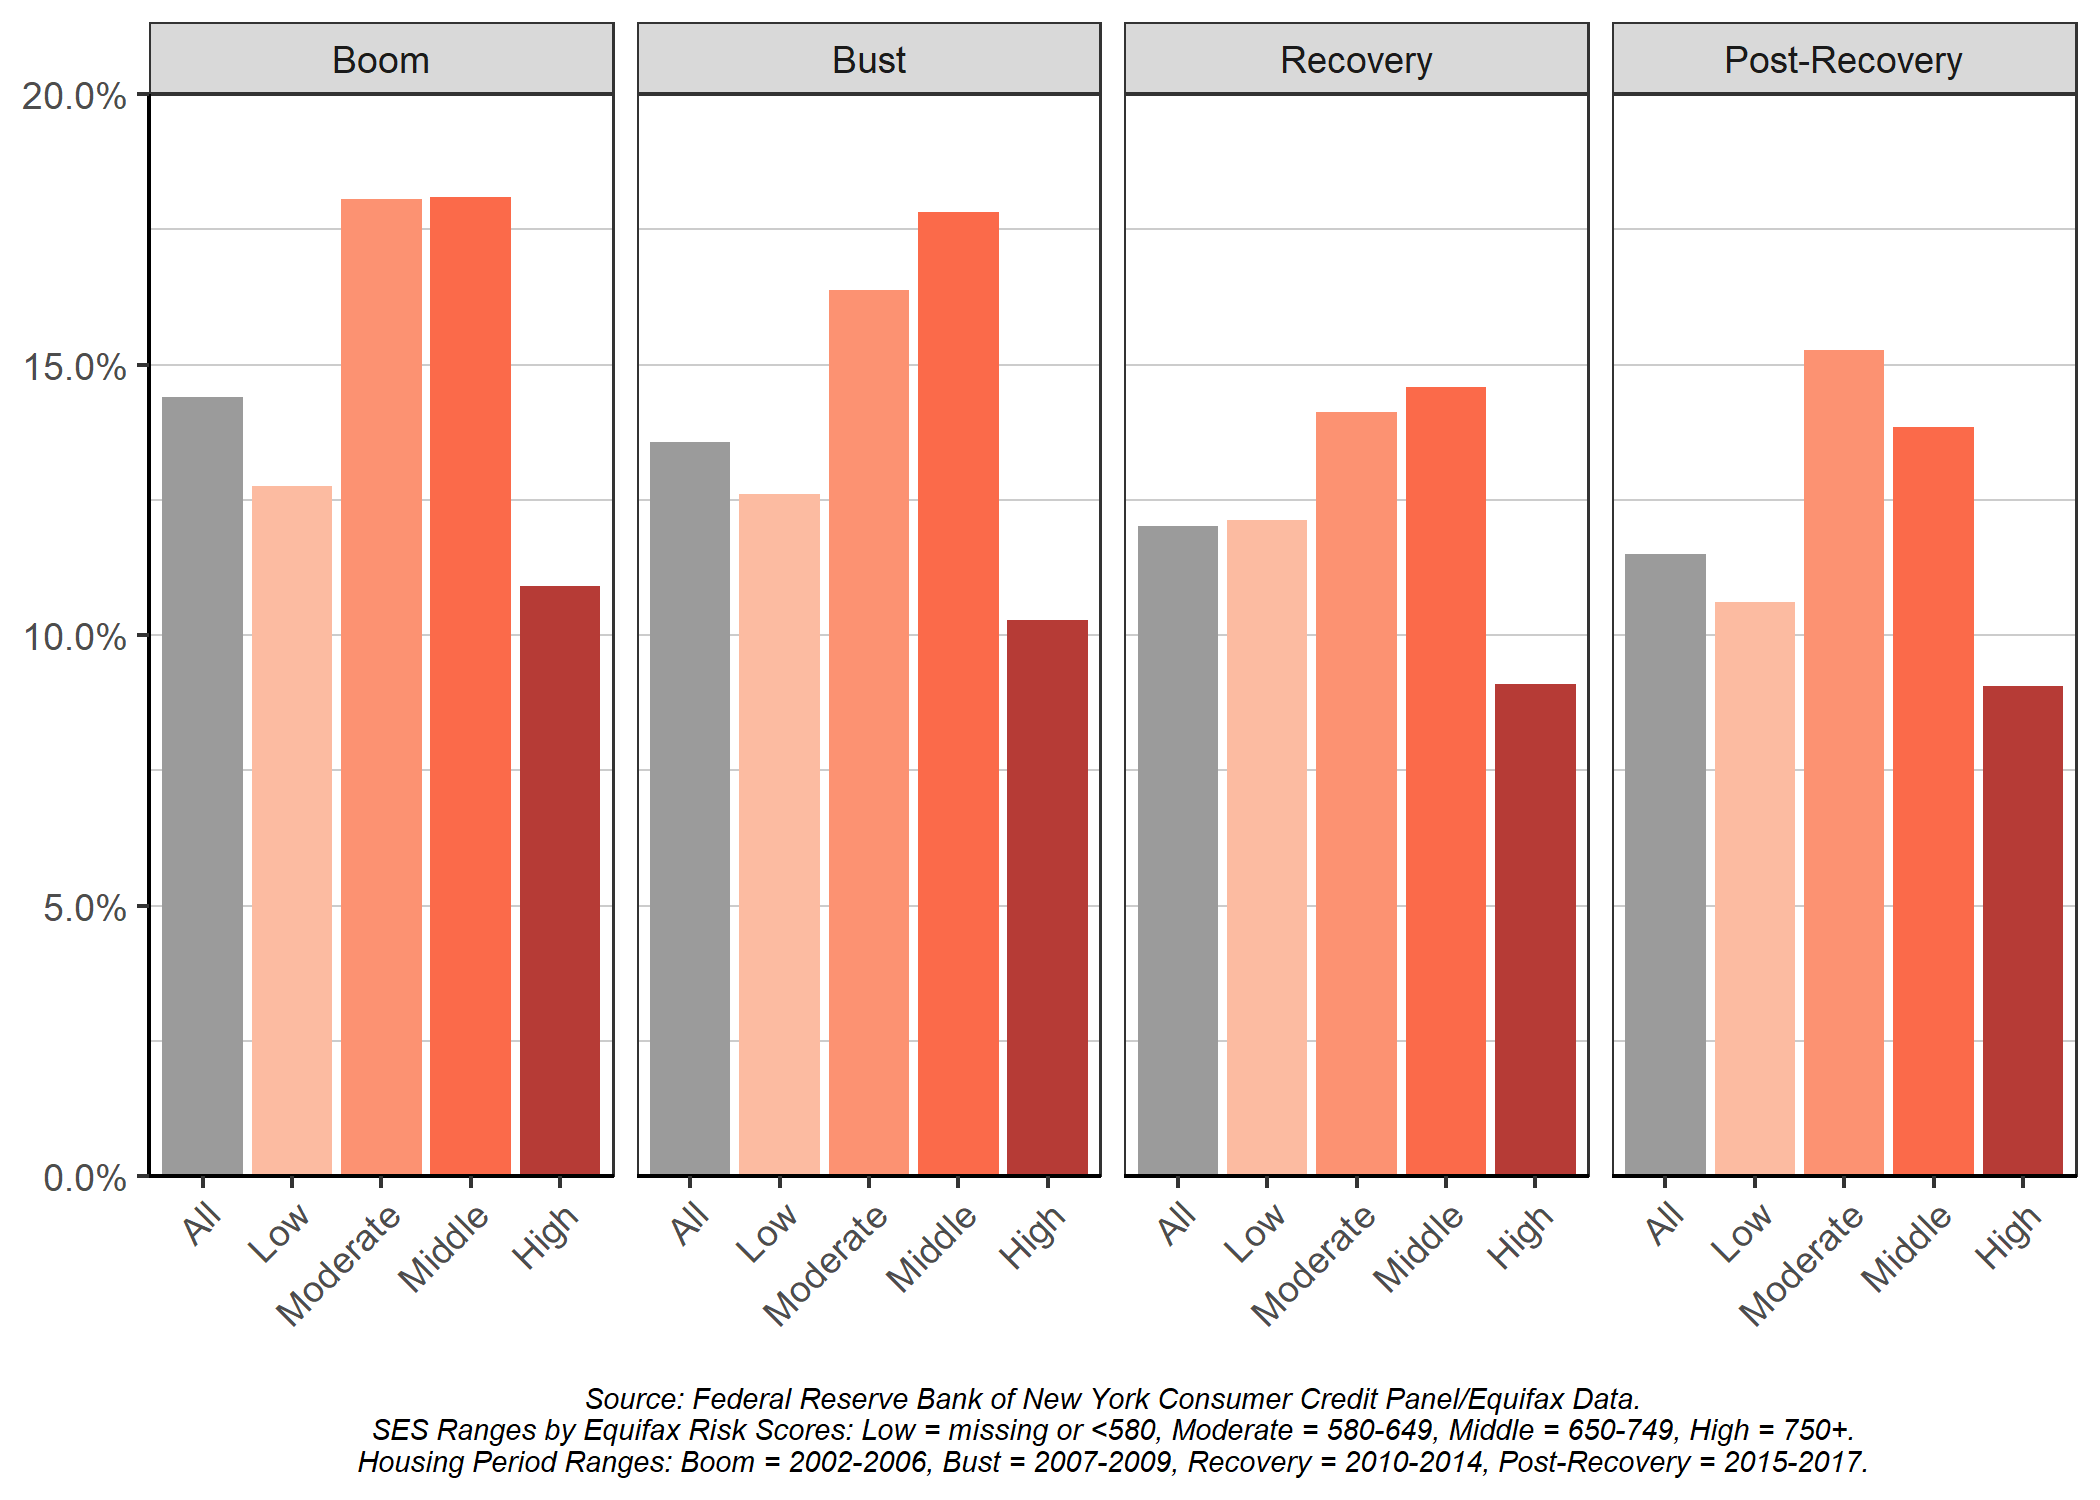
Across SES groups, Oakland residents moved the most before and during the Recession, and moderate- and middle-SES residents moved the most.
Figure 4: Percent of Oakland residents who moved from 2002-2018, by SES.
Surprisingly, moderate- and middle-SES moved the most (Figure 4). The lower rates of moving among low-SES residents may reflect the effectiveness of housing policies that protect residents from forced moves, like rent control and just cause for evictions, or the hesitancy to move due to the lack of affordable housing in the region. While low-SES residents moved less after the Recession and less than moderate- and middle-SES residents, they moved out of Oakland at higher rates after the Recession and disproportionately moved out of the Bay Area compared to other SES groups (see Figure 2).
Just prior to the COVID-19 pandemic, however, low-SES residents were moving at higher rates than other SES groups (Figure 5). These trends shifted over the last year. During the COVID-19 pandemic, low-SES residents moved at substantially lower rates than before the pandemic, but moderate-, middle-, and high-SES residents moved more. The declines in moving among low-SES residents may reflect the effectiveness of eviction moratoriums and relief programs issued in response to the pandemic. Higher rates of moving among lower-SES residents continued to be concentrated in Downtown and North Oakland during the pandemic.
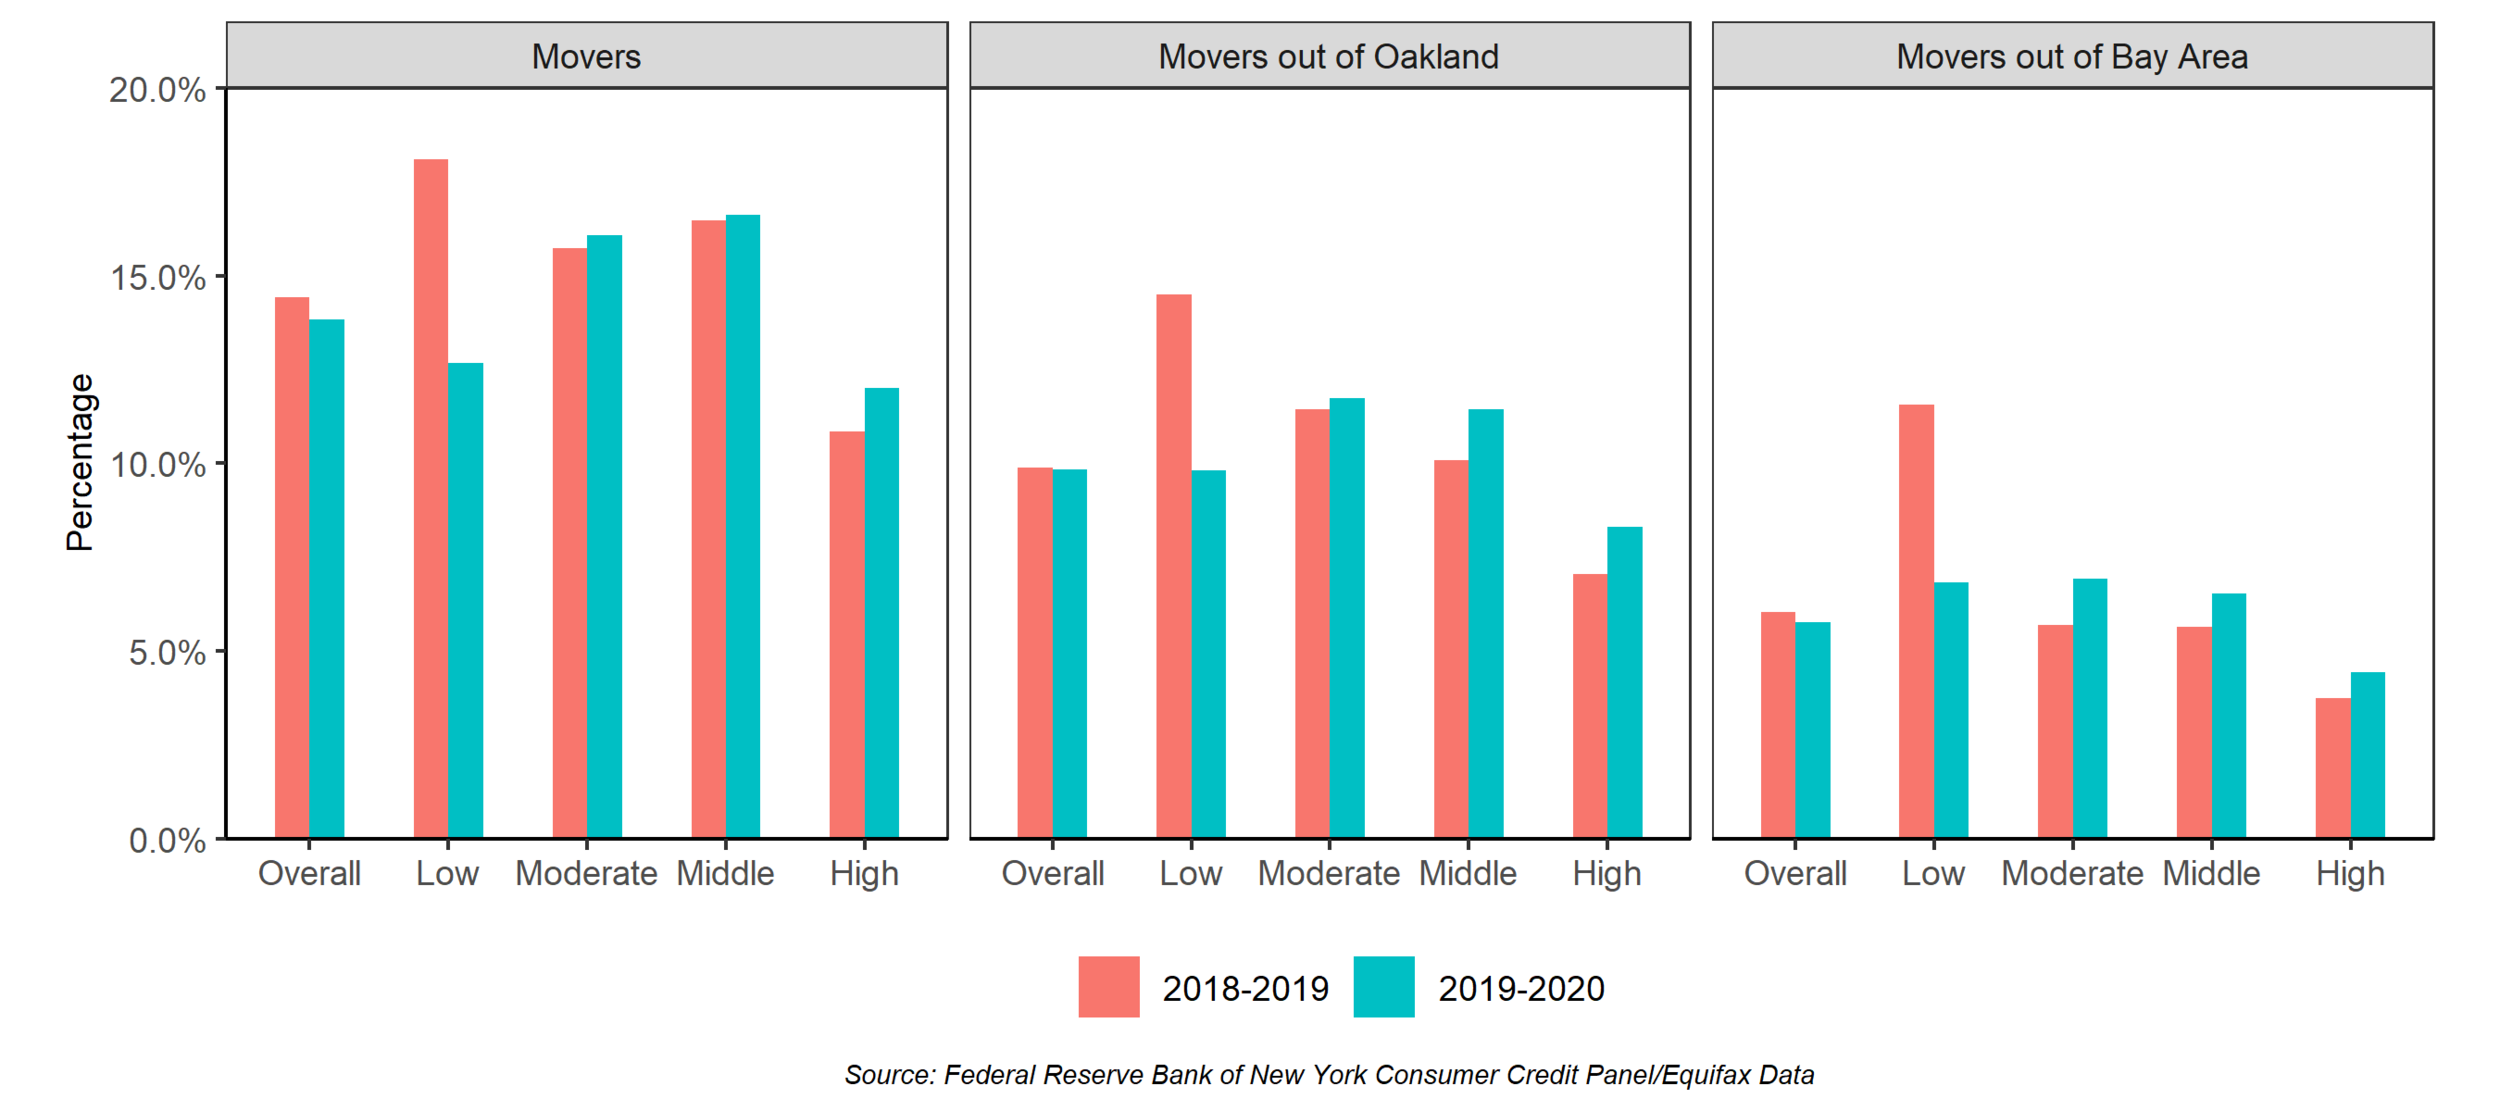
While low-SES residents moved much less, other SES groups moved more during the COVID-19 pandemic.
Figure 5: Percent of residents moving, moving out of Oakland, and moving out of the Bay Area from September 2018 - September 2020, by SES.

The neighborhoods with higher rates of eviction filings include areas in Deep East Oakland, Downtown, and West Oakland, where lower-SES residents are less likely to move from.
Figure 6: Eviction filing rates from 2018-2019.
While the eviction moratorium appears to be effective for mitigating moves among the lowest-SES residents, most people do not move as a result of evictions. Instead, people often move through informal forms of displacement, like the threat of eviction or increases in rents. The spatial distribution of eviction filings (which often do not result in actual evictions) from 2018-2019 does not align with where lower-SES residents are moving from (Figure 6). Instead, eviction filings are concentrated in areas in Deep East Oakland, Downtown Oakland, and West Oakland with higher levels of residents experiencing financial instability.
While some Oakland residents certainly undergo residential displacement as a result of evictions, informal forms of displacement are likely more prevalent. Residents may be choosing to move as they become delinquent on other accounts and rents steadily rise. Moreover, eviction filings may be a better indicator of other forms of instability that have impacts beyond displacement. We will discuss our findings on these other indicators of residential instability in our next blog post.
To ensure an equitable pandemic recovery, Oakland requires increased displacement protections for moderate-SES residents and continued support for efforts that mitigate the displacement of low-SES residents. Housing opportunities must also be provided and targeted for low- and moderate-SES residents. The COVID-19 pandemic has only exacerbated an existing housing crisis, and it is now more important than ever to continue displacement prevention efforts for lower-SES residents in Downtown and North Oakland. Nonetheless, the sharp declines in moving among low-SES residents point to the importance of examining other forms of residential instability that may not lead to displacement but have negative impacts on individuals’ well-being.
1 Hwang, Jackelyn, Vineet Gupta, and Bina P. Shrimali. 2021. “Neighborhood Change and Residential Instability in Oakland.” Federal Reserve Bank of San Francisco Community Development Working Paper 2021-1. doi: 10.24148/cdwp2021-01
2 Hwang, Jackelyn, and Vineet Gupta. 2021. “Residential and Neighborhood Instability in Oakland.” Retrieved from: https://ccrl.stanford.edu/publications/residential-and-neighborhood-instability-in-oakland
3 Boom (2002-2006), Bust (2007-2009), Recovery (2010-2014), Post-Recovery (2015-2017)
4 Ali Tadayon, “Former Black Panther, activist ‘Aunti Frances’ settles eviction case,” East Bay Times, Feb 27, 2018; Sam Levin, “‘We're being pushed out': the displacement of black Oakland,” The Guardian, Jun 1, 2018; Mustafa Solomon, “Life in the Time of Displacement,” Oakland Voices, Apr 15, 2016; “Displaced,” Youth Beat. Accessed: May 14, 2021
This is the first post in our series of Data Vignettes on Residential Instability in Oakland. Navigate to other posts in this series here.