

Oakland Vignette Series: Comparing the Effects of the Pandemic and the Great Recession on Residential Instability
Changing Cities Research Lab
Contributors: Jackelyn Hwang, Vineet Gupta, Becky Liang, Alisha Zhao, and Vasudha Kumar
September 7, 2021
This is the fifth post in our series of Data Vignettes on Residential Instability in Oakland.
The onset of the COVID-19 pandemic in early 2020 disrupted the economy in numerous ways, resulting in unprecedented levels of unemployment and new trends in residential instability in Oakland. While our previous posts on our report covered residential instability in Oakland since 2002, data from 2020 suggests that the effects of the pandemic thus far have been distinct from those of the Great Recession, which lasted from 2007 to 2009. While we can borrow some of the valuable lessons learned from the Great Recession, this post highlights findings from our report on the impact of the pandemic on residential instability. These findings suggest that policymakers and housing and community practitioners need to adapt to the unique nature of the current pandemic.
First, the COVID-19 pandemic and the Recession impacted the residential instability of Oakland residents differently by their socioeconomic status (SES), based on credit scores1. While moving rates remained high for all SES groups during the Great Recession, low-SES residents moved at much lower rates during the pandemic than before. Oakland residents, however, were increasingly constrained during the pandemic, as they increasingly shifted to crowded households and experienced credit score declines.
Second, patterns of the geographic distribution of moving differed between the pandemic and the Great Recession. Trends during the Recession showed both constrained moves and moves in general to be concentrated in Downtown Oakland and Temescal, while financial instability, as measured by declining credit scores, was concentrated in Deep East Oakland. During the pandemic, however, the prevalence of people moving into crowded housing and experiencing declines in financial stability were more widespread across the city.
Comparing Great Recession and Pandemic Instability Measures
In our report, we analyzed a restricted longitudinal dataset of over 12,500 Oakland residents each year from before and during the Recession (the “Boom” and “Bust” periods2). The impact of the proliferation of subprime lending and subsequent foreclosure crisis and financial insecurity brought on by the economic fallout on Oakland residents is clear (Figure 1): moving rates across SES groups remained at relatively high levels and barely changed, except for small decreases among moderate- and high-SES Oaklanders. Notably, the moving rate of low-SES Oaklanders did not change immediately with the onset of the Recession. Thus, we might expect a similar trend of high moving rates once the foreclosure and eviction moratoriums are lifted. These all-around sustained high moving rates were associated with high rates of high-SES residents moving into Oakland after the Recession.
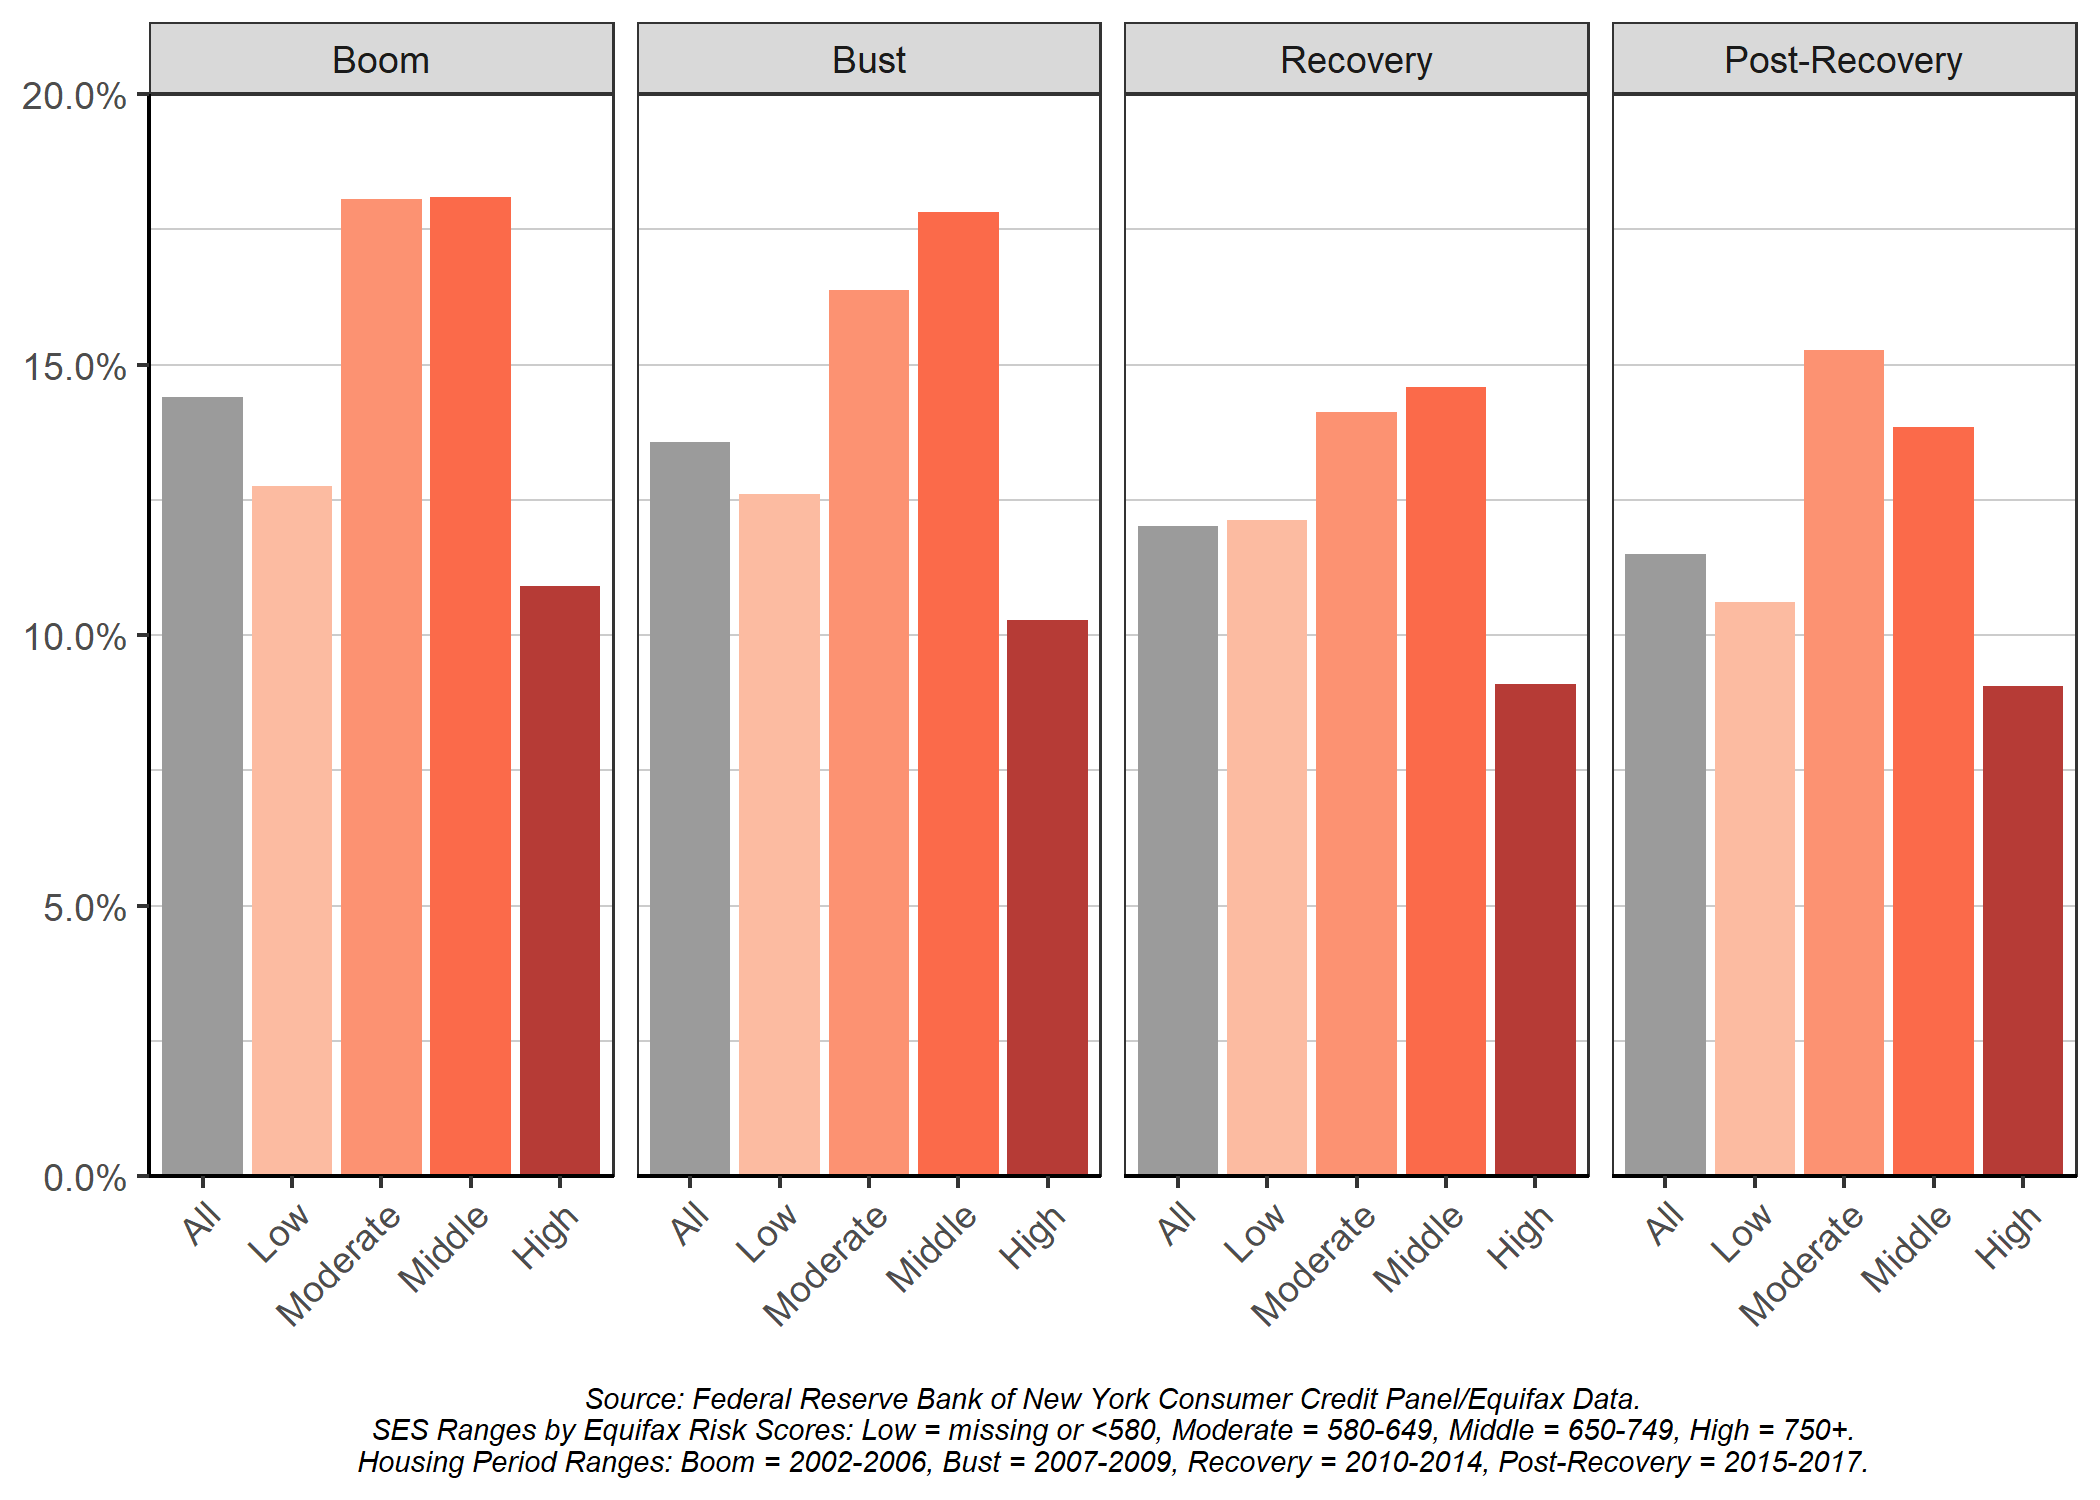
Across SES groups, Oakland residents moved at similarly high rates before (Boom) and during (Bust) the Recession.
Figure 1: Percent of Oakland residents who moved from 2002-2018, by SES
In contrast to the marginal immediate effect of the Great Recession on moving rates in all SES groups, that pattern did not hold with the onset of the pandemic. While year-over-year data shows that moderate-, middle-, and high-SES Oaklanders moved more between September 2019 and 2020 than the prior year, the same time period was associated with a large decrease in the moving rates of low-SES Oaklanders (Figure 2). The low-SES group, during this time, went from having the highest moving rate to the second lowest (the lowest, as expected, being the high-SES group).
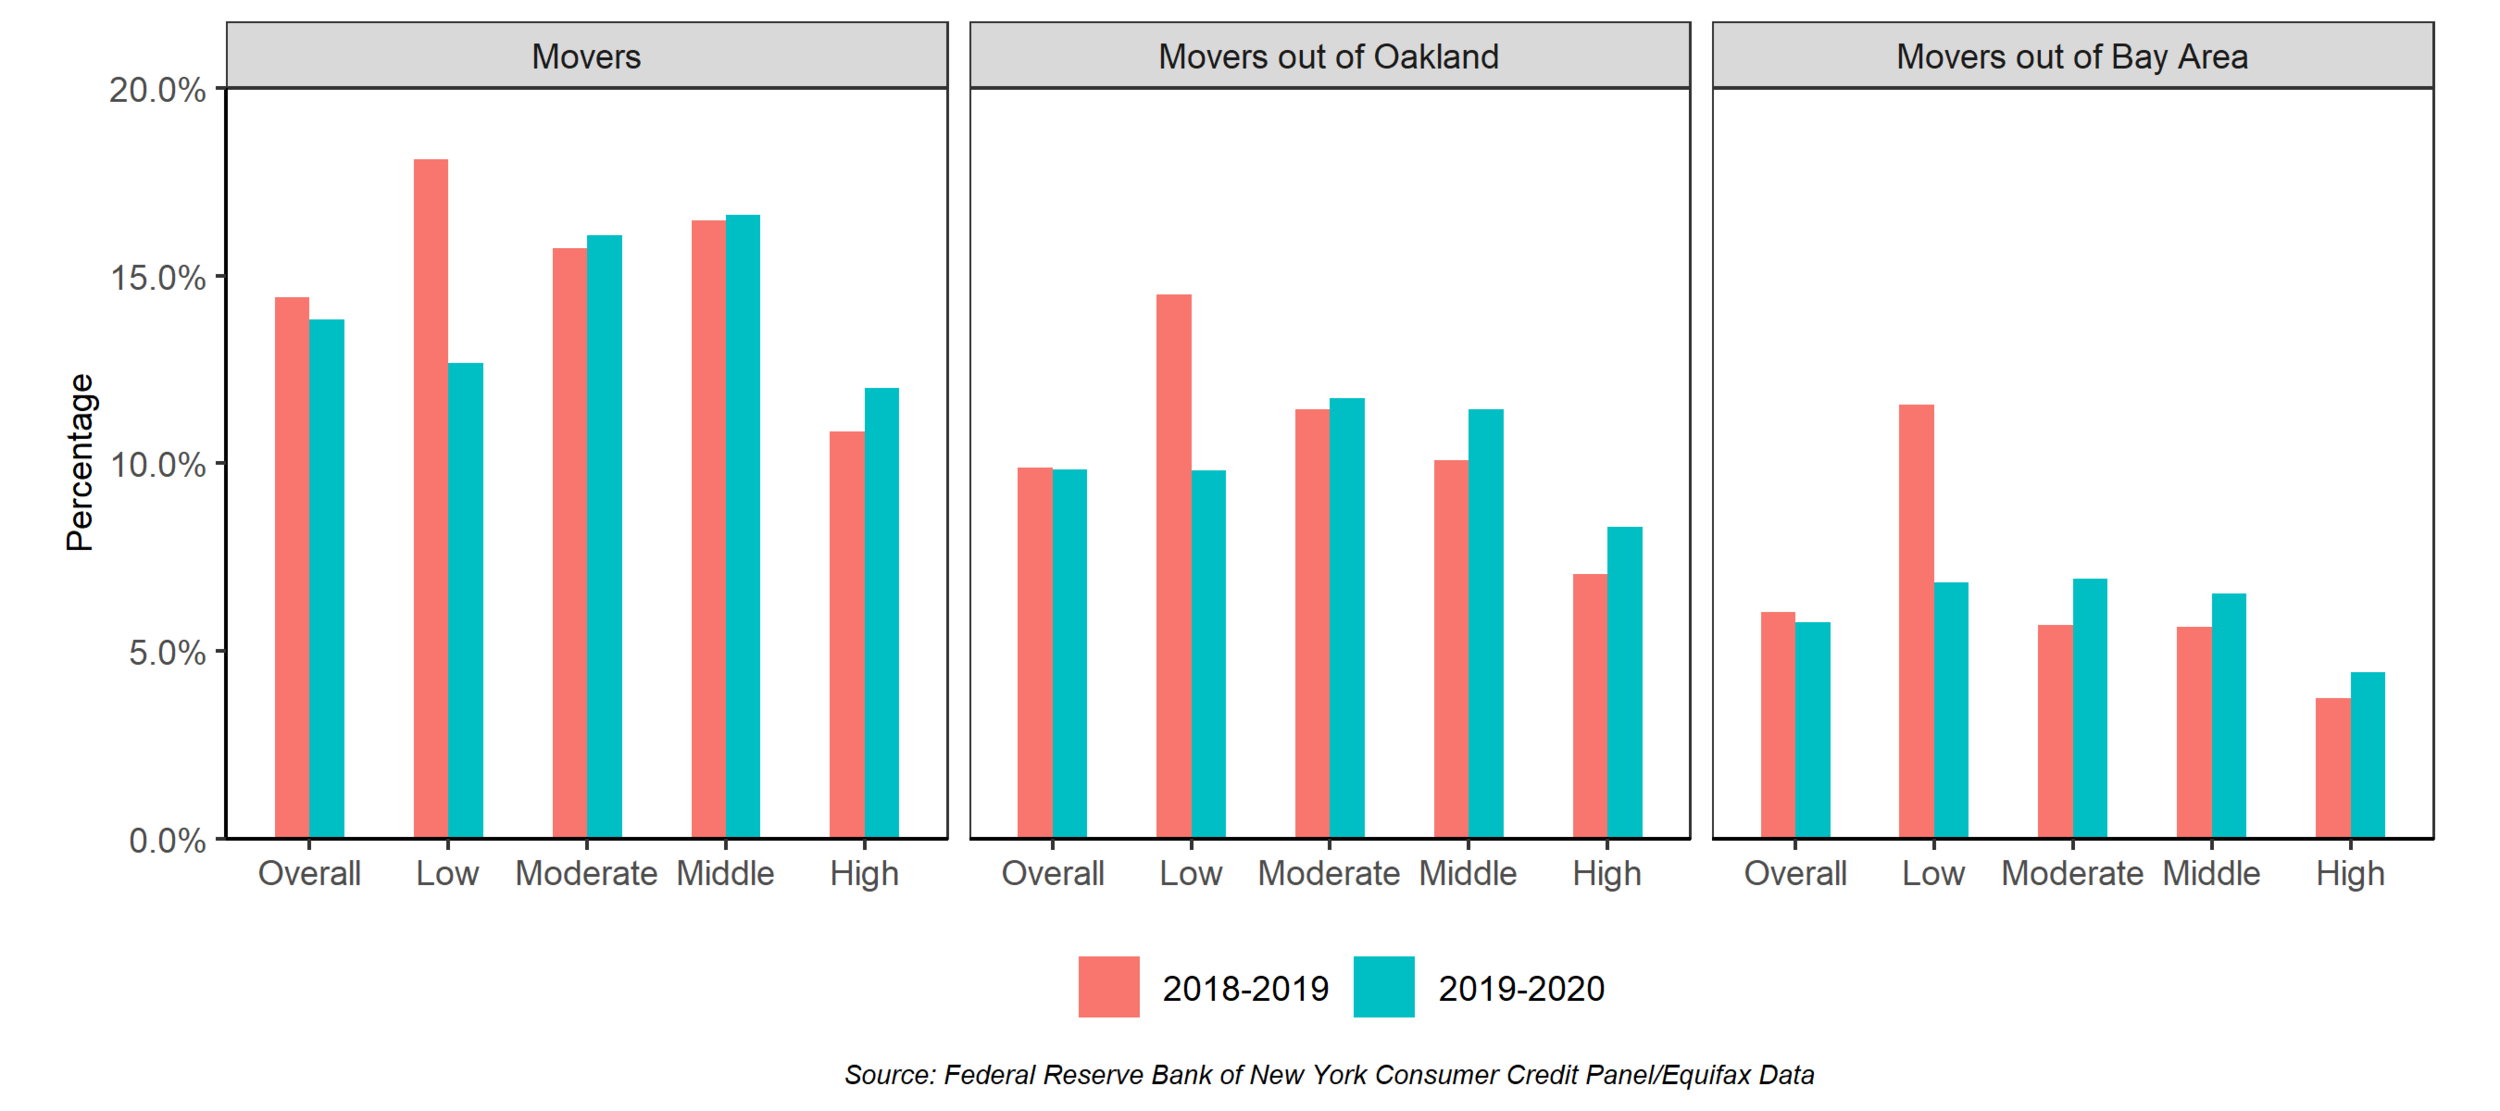
Low-SES residents moved much less during the COVID-19 pandemic, while other SES groups moved more.
Figure 2: Annual percent of residents moving, moving out of Oakland, and moving out of the Bay Area from September 2018 - September 2020, by SES
Furthermore, analysis of data on household characteristics from comparing changes from March to December 2020 to the nine-month period from June 2019 to March 2020 shows that Oaklanders in households with 1-3 adults increasingly moved to crowded households (having at least 4 adults) (Figure 3). More moderate-, middle-, and high-SES residents also became low-SES residents compared to before the pandemic.
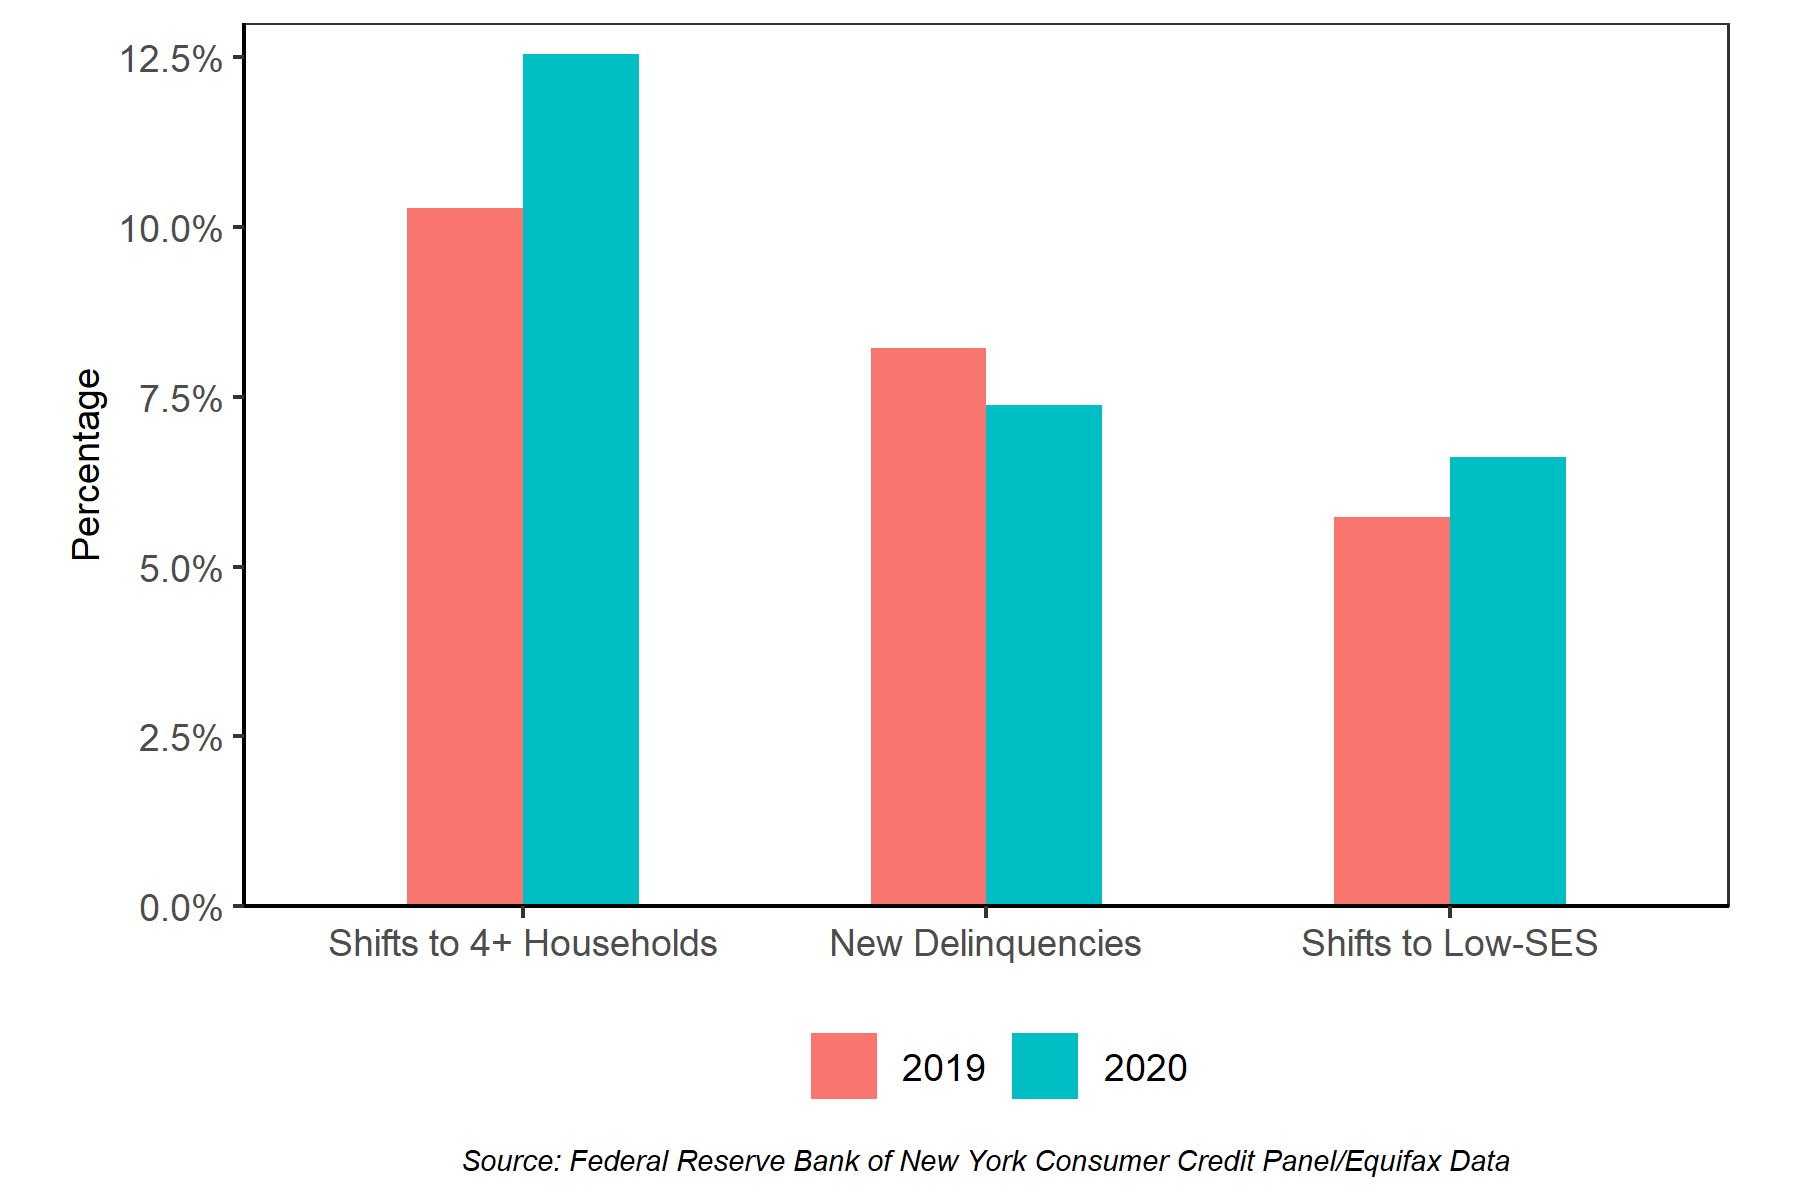
During the COVID-19 pandemic, Oakland residents were more likely to move to crowded households and become low-SES
Figure 3: Percent of residents moving to 1-3 person households, taking on new delinquencies, and shifting to low-SES
Residents did not gain new delinquencies on credit accounts at higher rates during the pandemic than before, however. The significant governmental response to the pandemic—stimulus checks and extended unemployment benefits—may have played a role in allowing many but not all families to keep afloat financially. However, observed increases in the other measures—crowding and downward declining credit scores—suggest that Oakland residents nevertheless faced more constraints. For example, a resident may lower their housing costs to avoid delinquency at the cost of a more crowded household. Similarly, some residents may see a decline in their credit scores as they borrow more, but nevertheless make minimum payments and thus avert new delinquencies.
Comparing Recession and Pandemic Geographies
The geographic distribution of moving during the Recession and pandemic differed as well. Trends during the Recession showed both constrained moves and moves in general to be concentrated in Downtown Oakland and North Oakland, while financial instability was concentrated in Deep East Oakland. During the pandemic, however, residents who made constrained moves (specifically, those into more crowded households) as well as households gaining new delinquencies were more widespread across the city.
As discussed in the first vignette of this series, lower-SES (low- and moderate-SES) residents consistently moved at higher rates out of Downtown and North Oakland; this geographical concentration deepened further during the Great Recession (Bust). Lower-SES residents who moved to more crowded living situations during the Recession primarily moved from Downtown and West Oakland, and those with financial delinquencies during the same period were concentrated in Deep East Oakland. Both trends are visible in Figure 4.
During the Recession, lower-SES residents moved into more crowded households primarily from Downtown & North Oakland (left), while residents who gained financial delinquencies were most concentrated in Deep East Oakland (right).
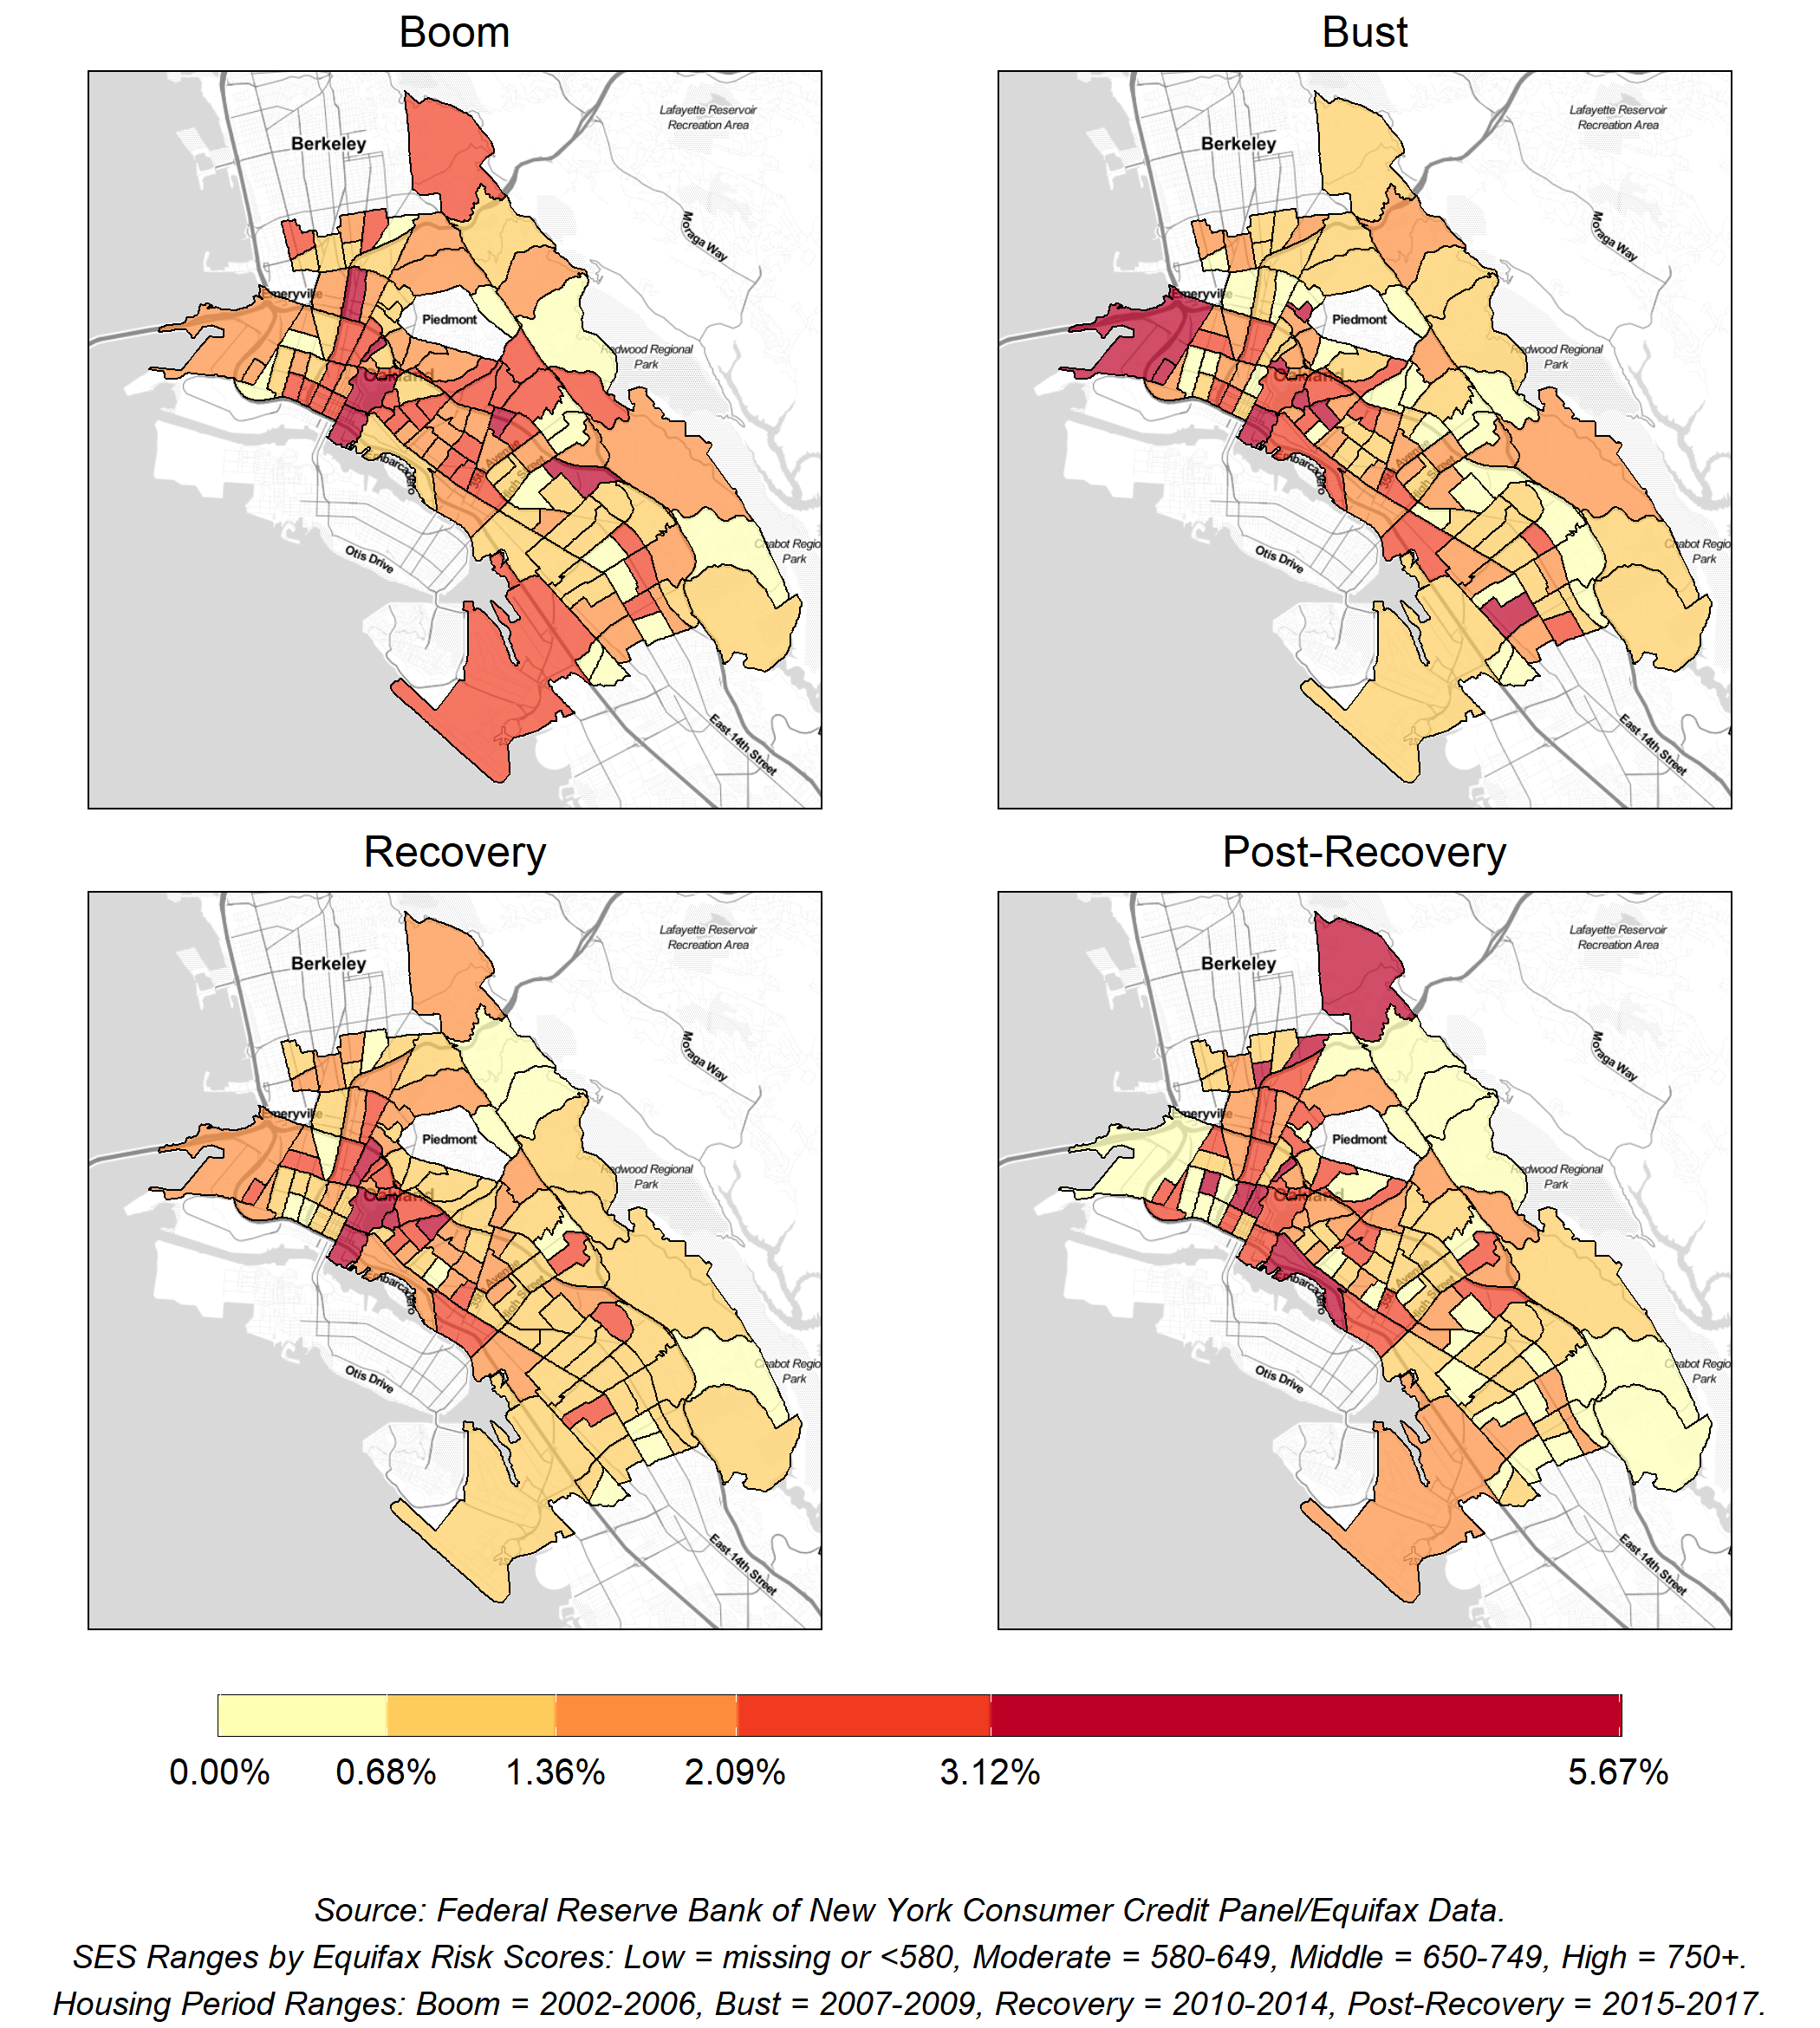
Figure 4 a: Percentage of low-, moderate-, and middle-SES residents shifting from 1-2- to 4+ adult households, by housing period 2002-2018
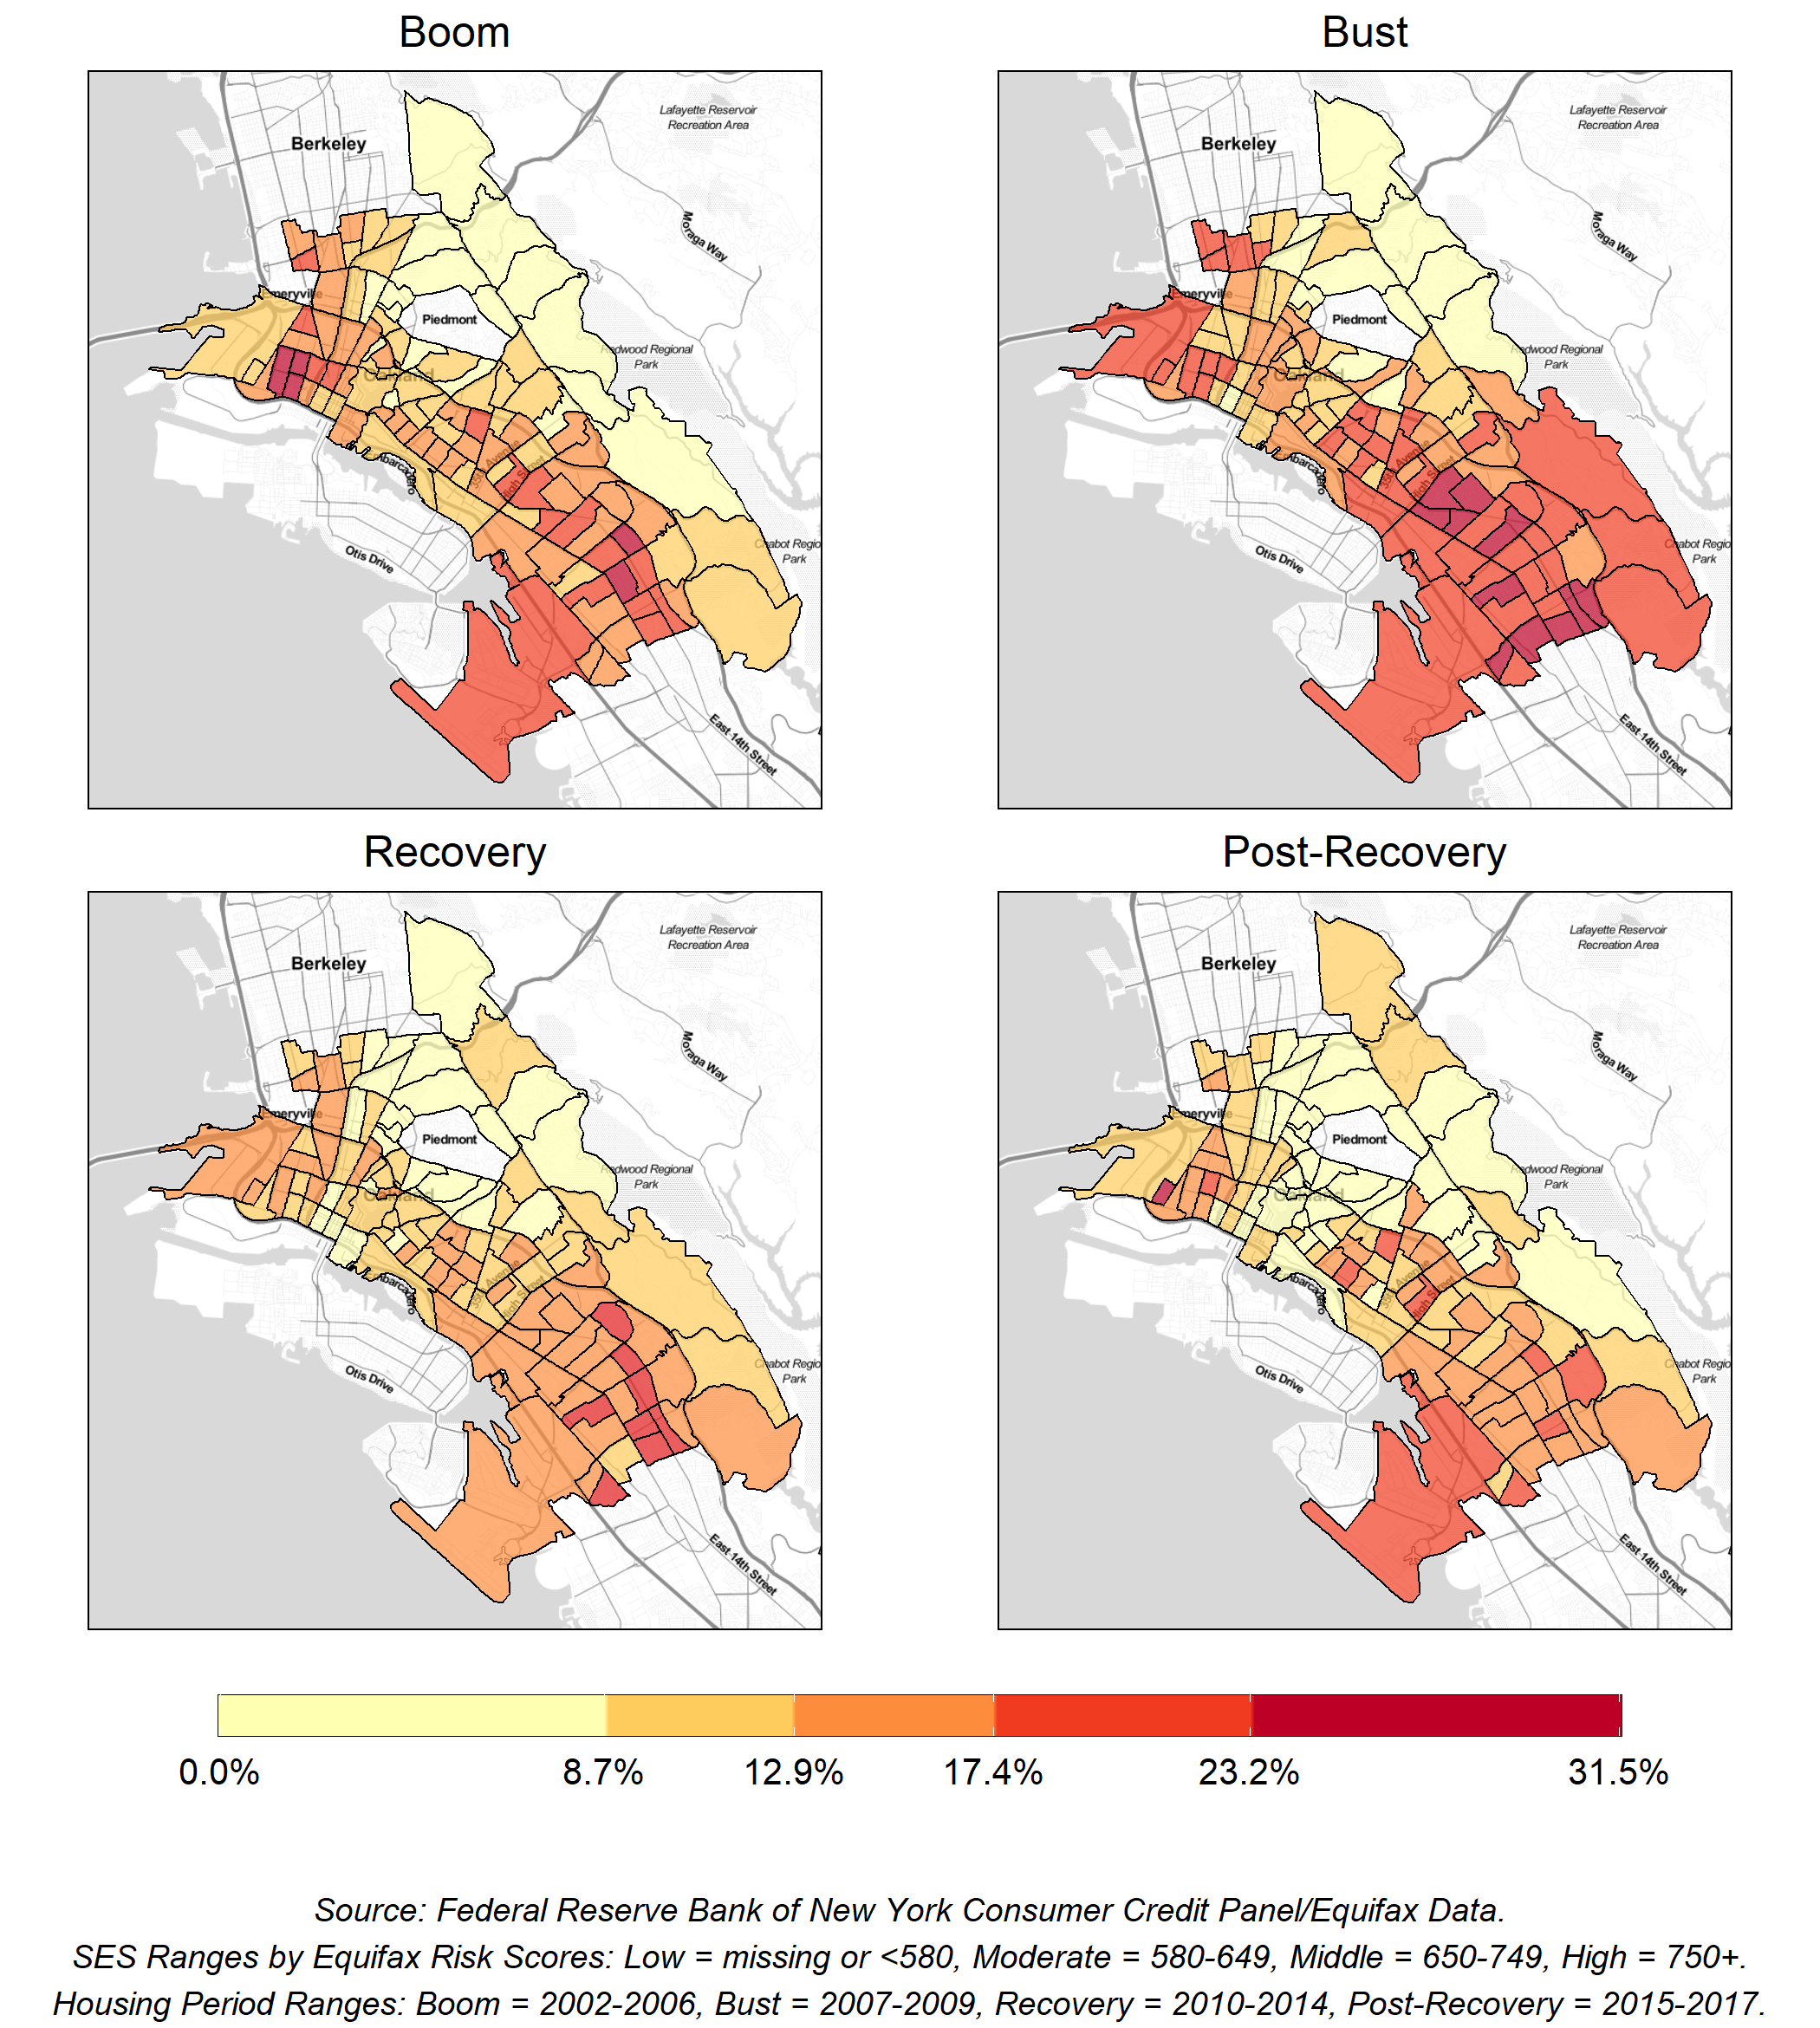
Figure 4 b: Percentage of low-, moderate-, and middle-SES residents in households who became delinquent on a financial account, by housing period 2002-2018
Based on trends during the Recession and associated neighborhood characteristics, we predicted moving rates, crowding, and financial delinquencies during the pandemic to cluster in similar neighborhoods as in the Recession. However, the 2020 data show that constrained moves and delinquencies were more widespread across all of Oakland. In Figure 5 below, these metrics each appear to be spread across several neighborhoods in North Oakland, West Oakland, and throughout East Oakland—and all of the changes are more widespread than the changes at the onset of the Recession. However, areas with high moving rates in the past had similarly high moving rates during the pandemic.
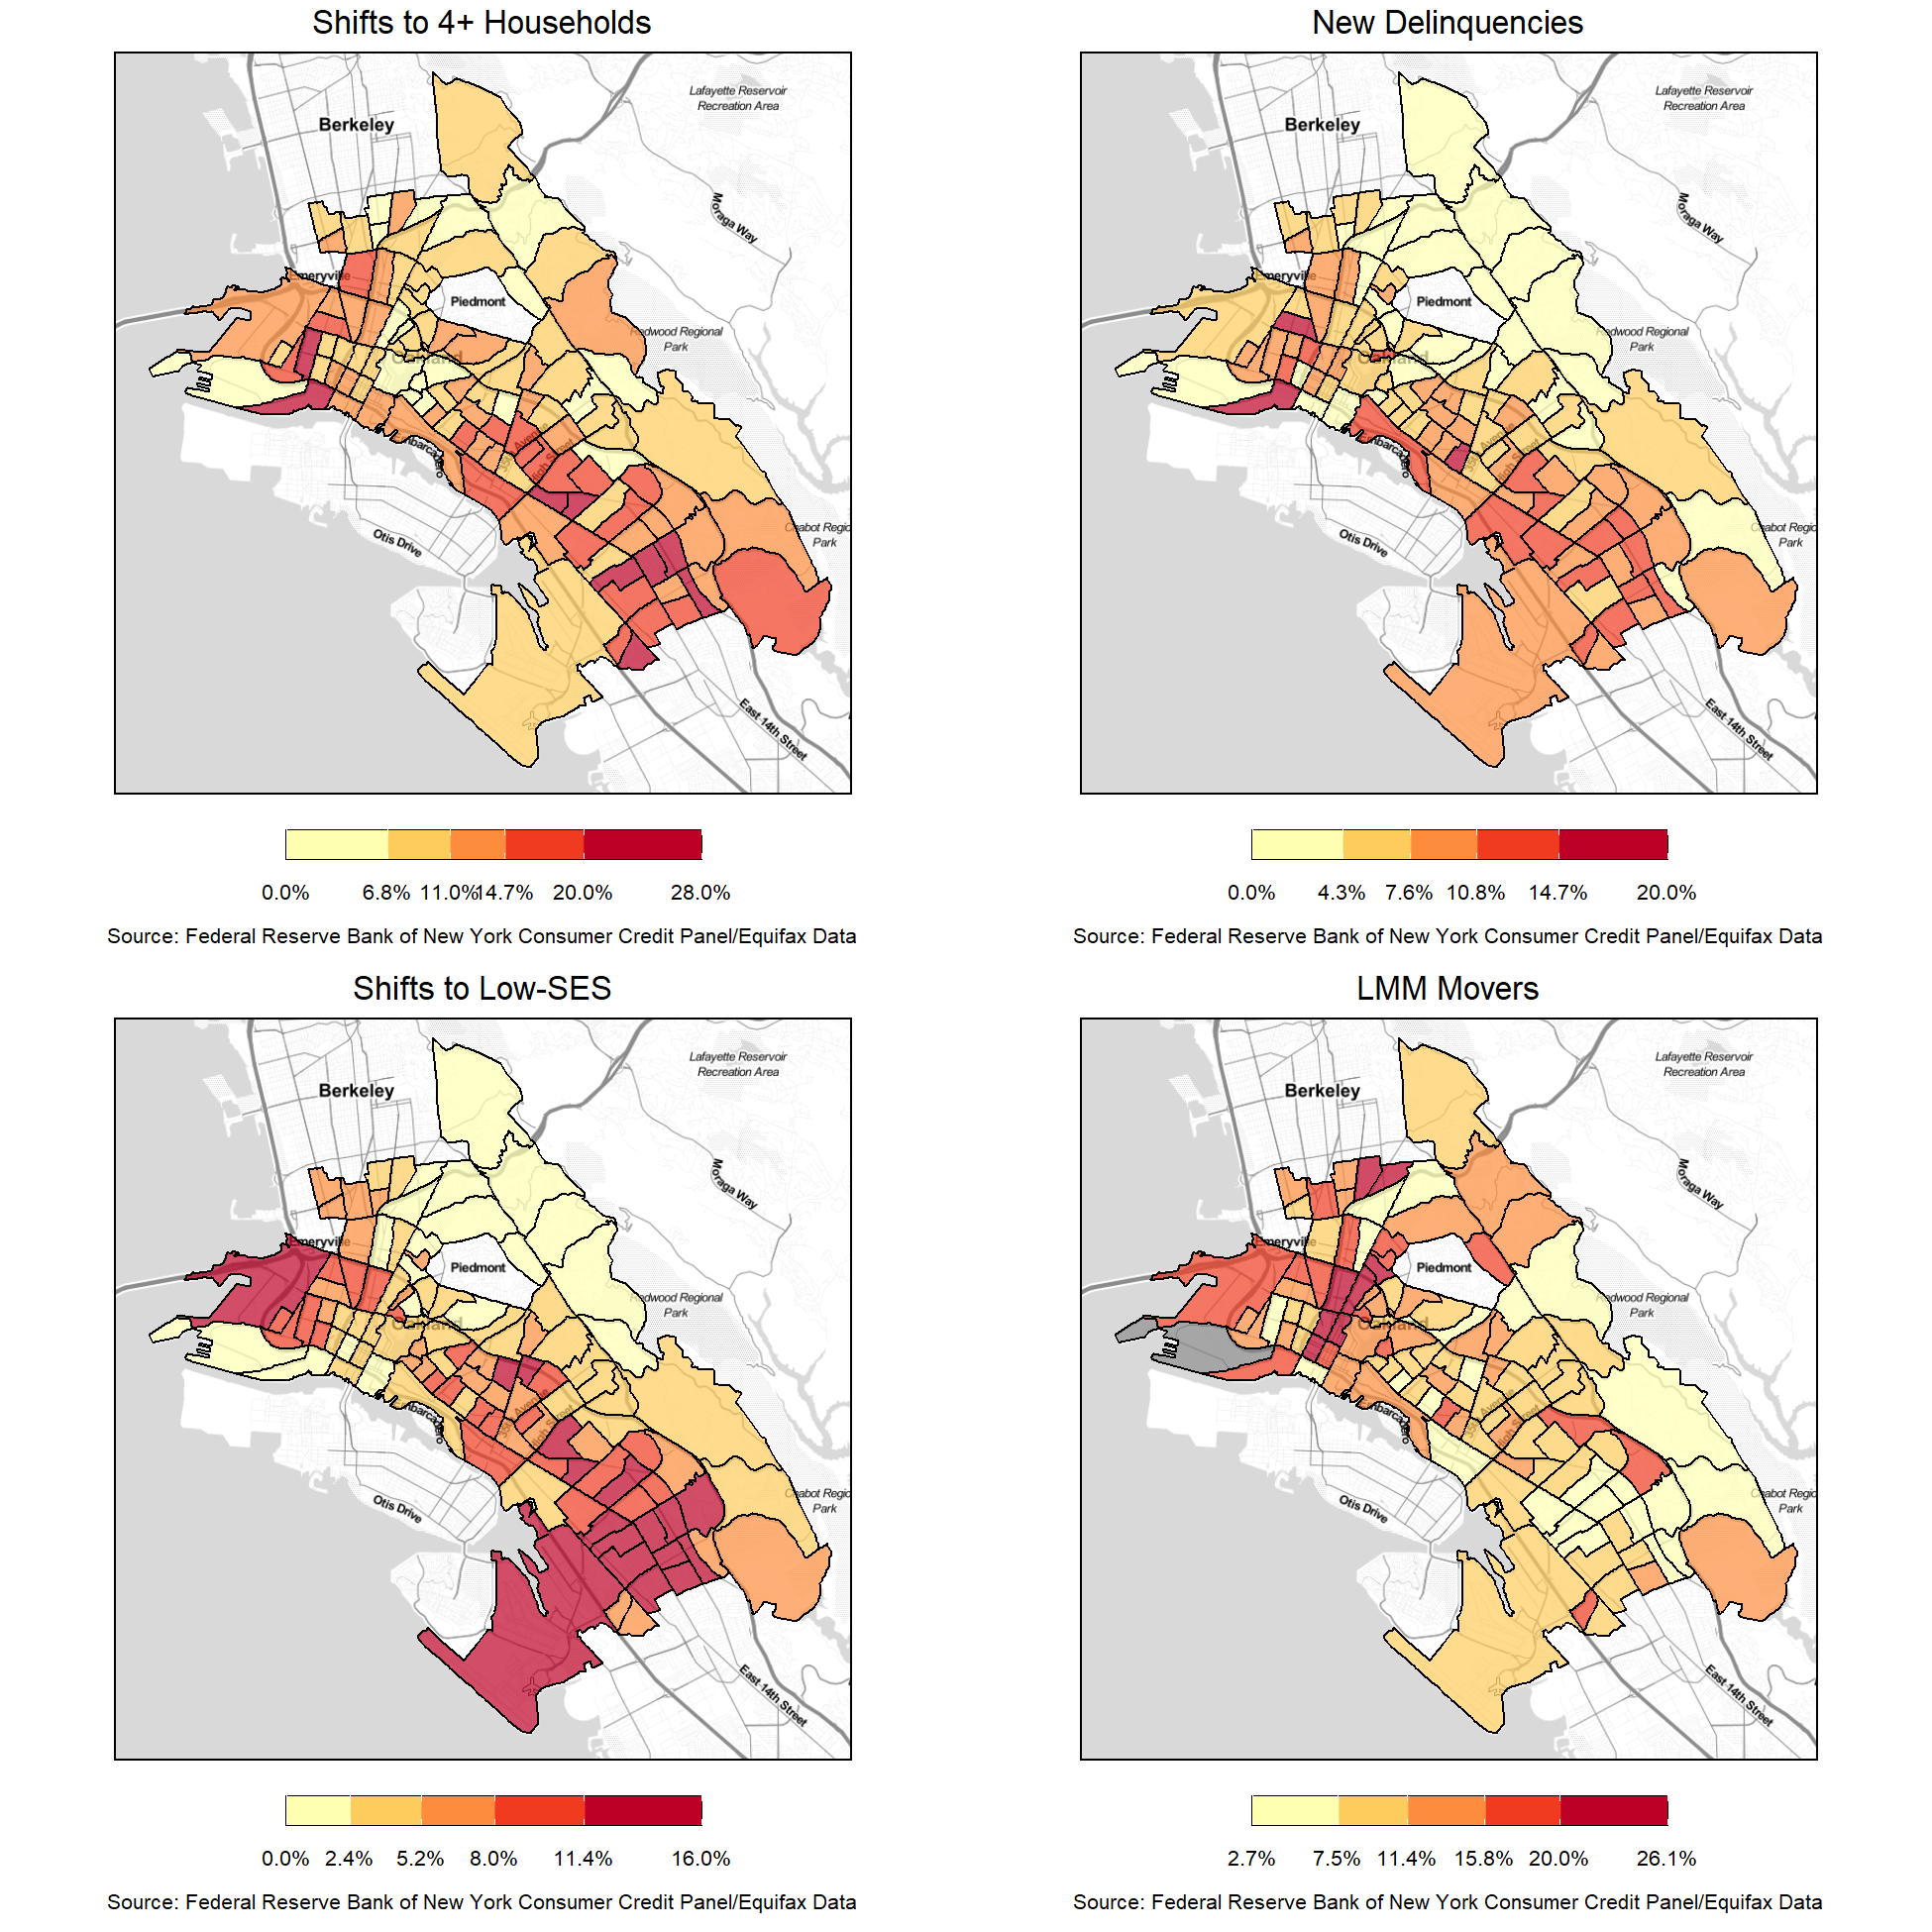
During the COVID-19 pandemic, shifts to crowded households, delinquencies, and shifts to low-SES have seen widespread increases across Oakland
Figure 5: Percentage of residents moving to 4+ households, gaining new delinquencies, shifting to low-SES, and moving (among low-, moderate-, and middle-SES residents)
The COVID-19 pandemic quickly affected Oakland residents in its first year3. Unlike the trends on residential instability of the Great Recession—where moving rates remained high across all SES groups—the pandemic was associated with a drop in the rate at which the lowest SES group moved, as well as increasing moves to crowded households and downward shifts in credit scores. Increased crowding and financial instability localized to certain neighborhoods in the past, but the pandemic broadened these trends across other parts of the city.
As governments across the country begin to roll back their pandemic-related orders, eviction and foreclosure moratoriums have begun to expire. Oaklanders who were protected from the pandemic’s immediate effects by local, state, and federal moratoriums may be at risk of being left behind. For this reason, there is an urgent need to monitor areas of shifts to crowding and high financial instability identified in this report as precursors to residential displacement when existing protections end. Tracking these unique geographies of financial instability and crowding can help the city to design and improve policies that protect residents from displacement as the immediate effects of the pandemic give way to potentially distinct long-term ones.
1 SES categories are based on Equifax Risk Scores, a type of credit score that ranges from 280 to 850 and approximates financial stability rather than income or wealth. Low-SES refers to a score less than 580 or no score, moderate-SES refers to a score between 580 and 649, middle-SES refers to a score between 650 and 749, and high-SES refers to a score at 750 or greater.
2 Boom (2002-2006), Bust (2007-2009), Recovery (2010-2014), Post-Recovery (2015-2017)
3Bliss, Laura and Lorena Rios. 2020. “Tracing the Invisible Danger of Household Crowding.” Bloomberg.; Dougherty, Conor. 2020. “12 People in a 3-Bedroom House, Then the Virus Entered the Equation.” The New York Times.; Romero, Farida Jhabvala. 2020. “'What Am I Going to Do?' For Families Losing Wages, Bay Area Rents Are Now a Crisis.” KQED.
This is the fifth post in our series of Data Vignettes on Residential Instability in Oakland.