Oakland Vignette Series: A Tale of Two Cities - Residential Instability and Disinvestment in Oakland
Changing Cities Research Lab
Contributors: Jackelyn Hwang, Vineet Gupta, Becky Liang, Alisha Zhao, and Vasudha Kumar
September 7, 2021
This is the fourth post in our series of Data Vignettes on Residential Instability in Oakland.
While lower-socioeconomic status (SES) Oakland residents have faced increasingly constrained choices since the Great Recession as a whole, moving and moves to crowded housing have been concentrated in Downtown and parts of North/West Oakland, while financial instability and disinvestment have been concentrated in Deep East Oakland and some parts of West Oakland, particularly in historically Black neighborhoods. Our second post on constrained moves covered crowding and financial instability as two sets of measures that reflect residential instability. This post delves into neighborhood trends to show how different neighborhoods across Oakland are impacted by displacement, crowding, financial instability, and disinvestment.
In our report, SES categories are based on Equifax Risk Scores, a type of credit score that ranges from 280 to 850 and approximates financial stability rather than income or wealth. Low-SES refers to a score less than 580 or no score, moderate-SES refers to a score between 580 and 649, middle-SES refers to a score between 650 and 749, and high-SES refers to a score at 750 or greater.
Downtown Oakland and Parts of North and West Oakland
West Oakland and parts of North Oakland and Downtown Oakland experienced the highest intensities of gentrification.
Figure 1: Maps of Gentrification Neighborhood Category
While all previously low-income neighborhoods in Oakland exhibited some signs of gentrification, West Oakland and parts of North Oakland and Downtown Oakland experienced the highest intensities of gentrification1 (Figure 1).
Lower-SES residents living in these neighborhoods with greater intensities of gentrification as well as historically wealthier and whiter neighborhoods moved more, compared with other neighborhoods. Moving rates in Downtown Oakland and parts of North Oakland remained consistently in the top two quintiles, and rates of moving out of Oakland increased in these areas from the recovery to the post-recovery period when the housing market recovered from the Great Recession(Figure 2). Moving rates out of Oakland in these areas were similar to overall moving rates. This suggests that lower-SES residents who may have been displaced from these areas increasingly moved out of Oakland altogether in the post-recovery period as housing options became increasingly limited in the city.
Lower-SES Movers Disproportionately Moved from Downtown and parts of North Oakland.
Figure 2: Maps of Percentage of Low-, Moderate-, and Middle-SES Oakland Residents Who Move, by Housing Period
Similar to trends in gentrification, Oakland's lower-SES residents moved and moved to households with more adults at higher rates in Downtown Oakland and parts of North and West Oakland. Across all housing periods, Downtown Oakland had a greater proportion of residents move and shift to higher-density households (Figure 3). During the post-recovery period, the shift to high-density households also occurred more among movers from North Oakland and parts of West Oakland.
Downtown Oakland, North Oakland, and parts of West Oakland had a greater proportion of residents move and shift to higher-density households.
Figure 3: Maps of the Percentage of Low-, Moderate-, and Middle-SES Oakland Residents Who Shifted from Low-Density to High-Density Households, by Housing Period
Deep East Oakland and Parts of West Oakland
New delinquencies and increases in low-SES residents during the post-recovery period were most prevalent in East Oakland, including in places showing early signs of gentrification, and parts of Downtown Oakland.
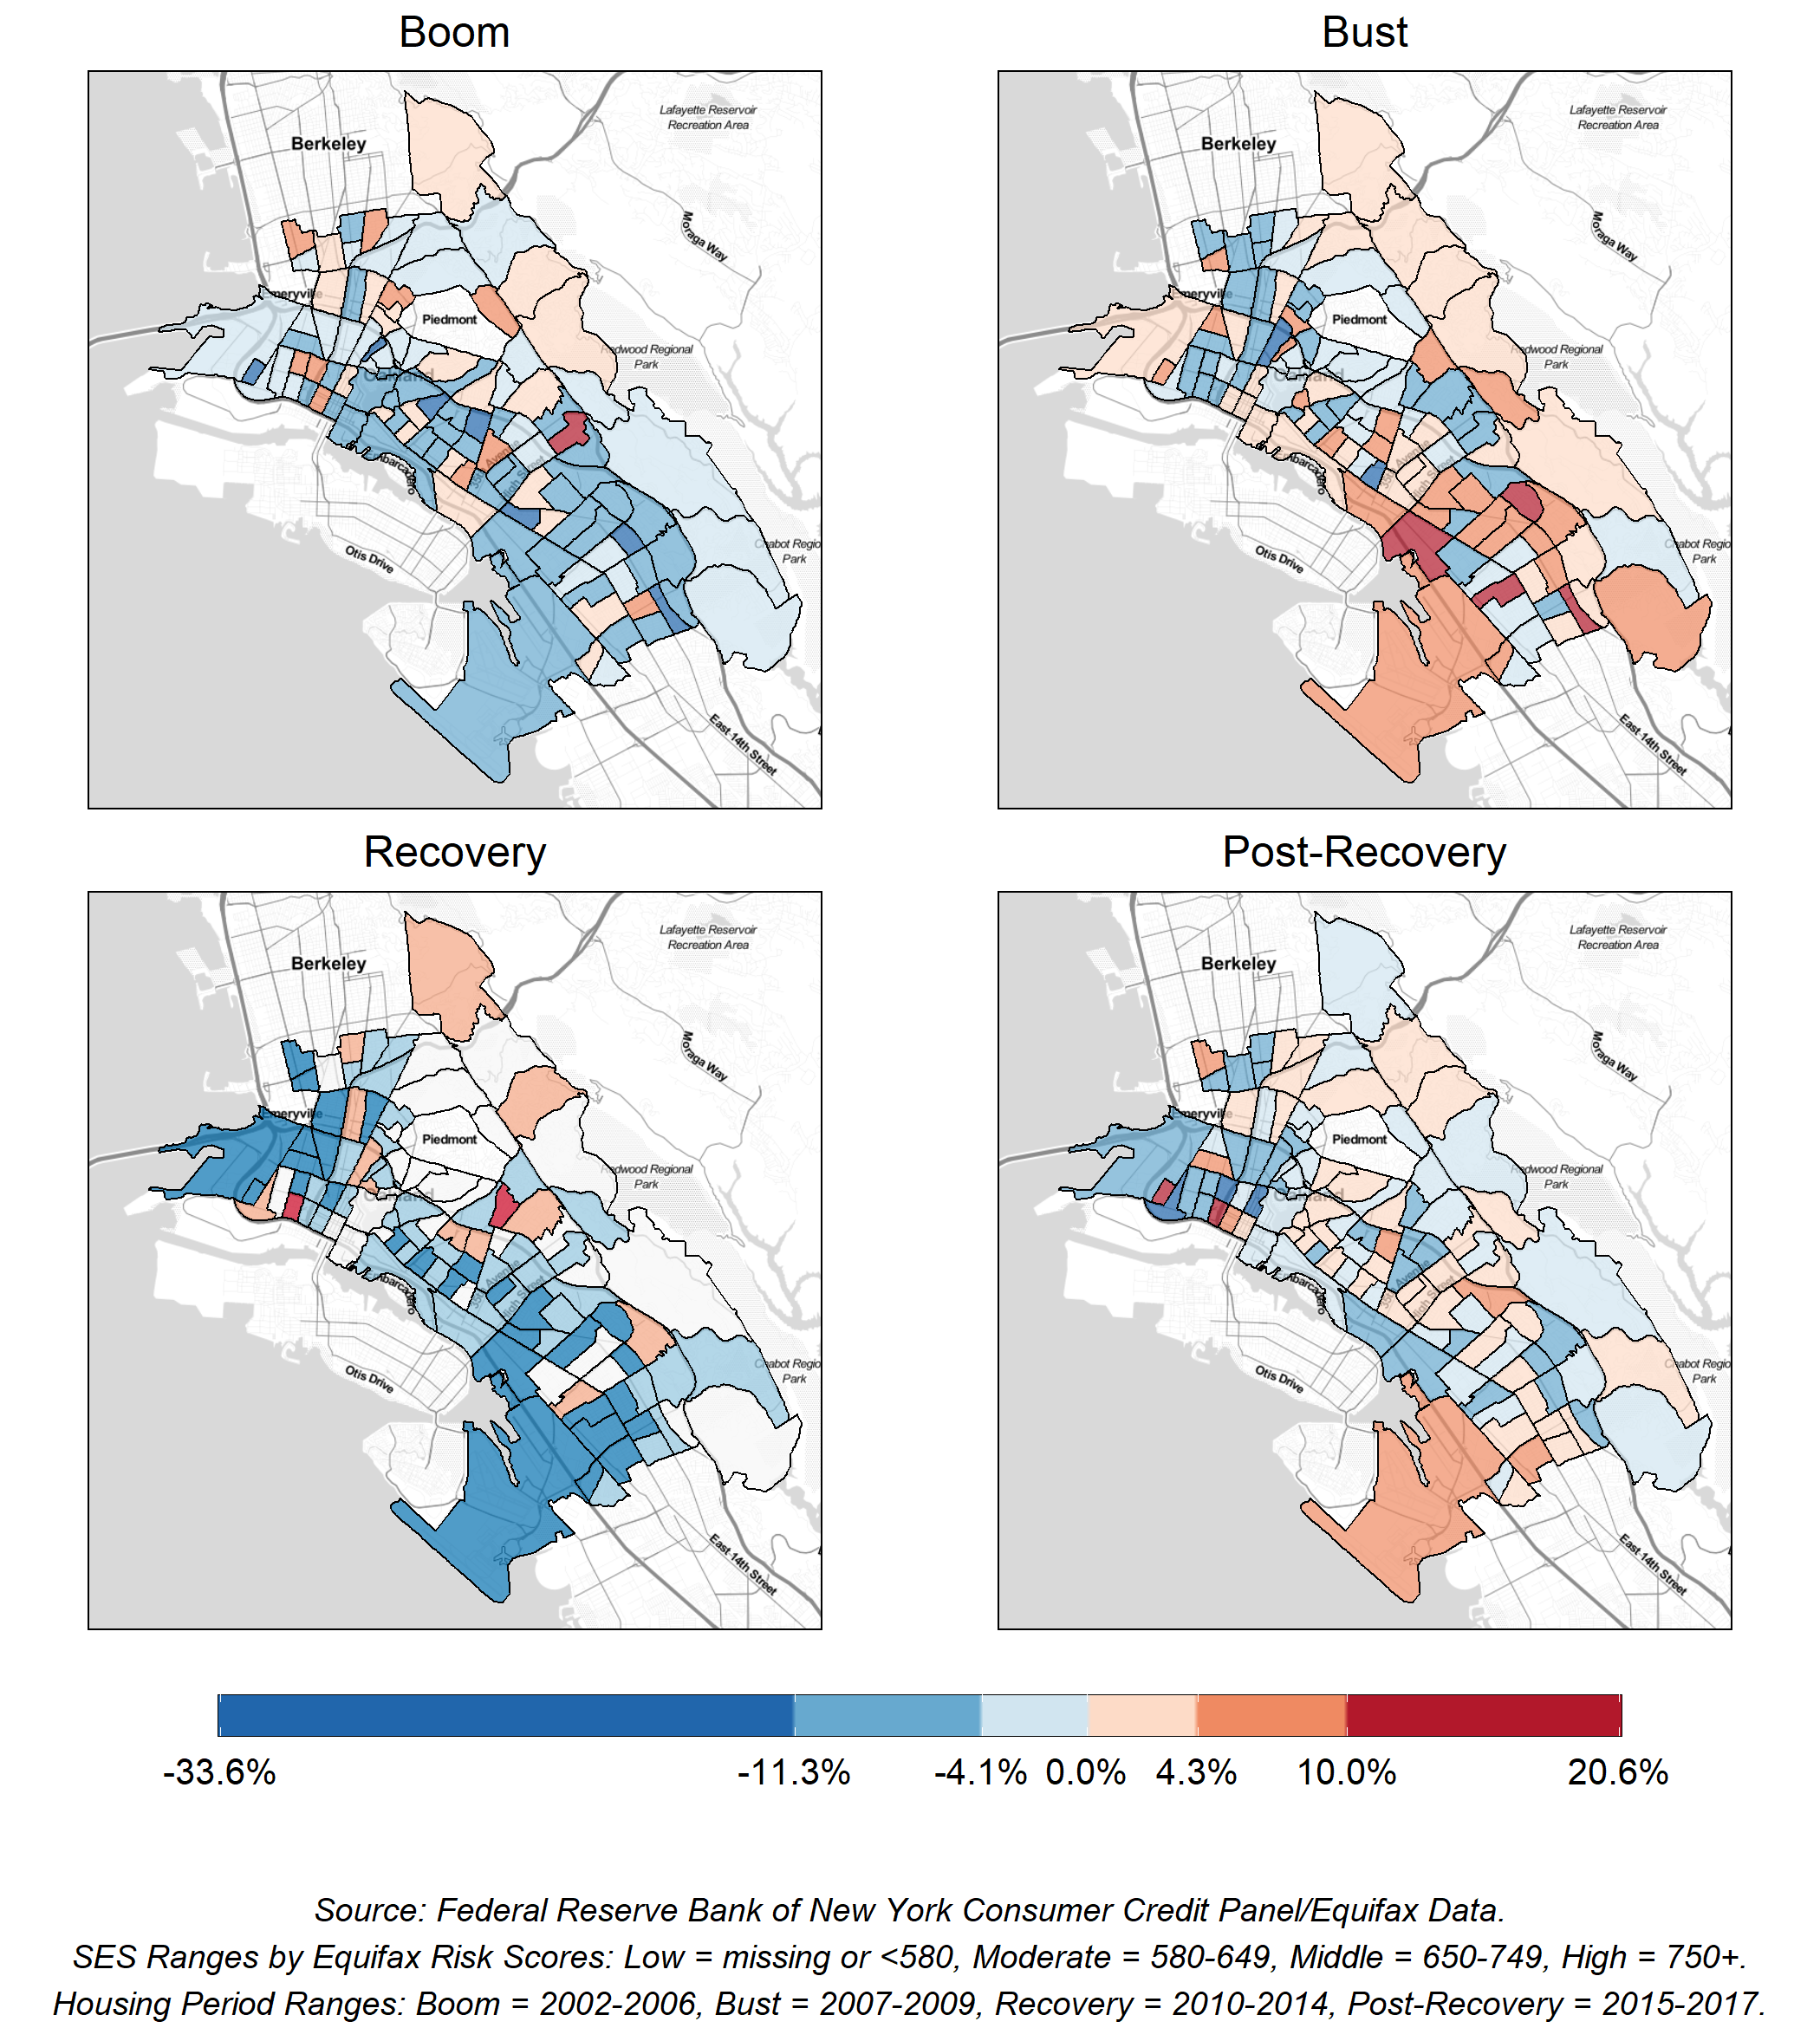
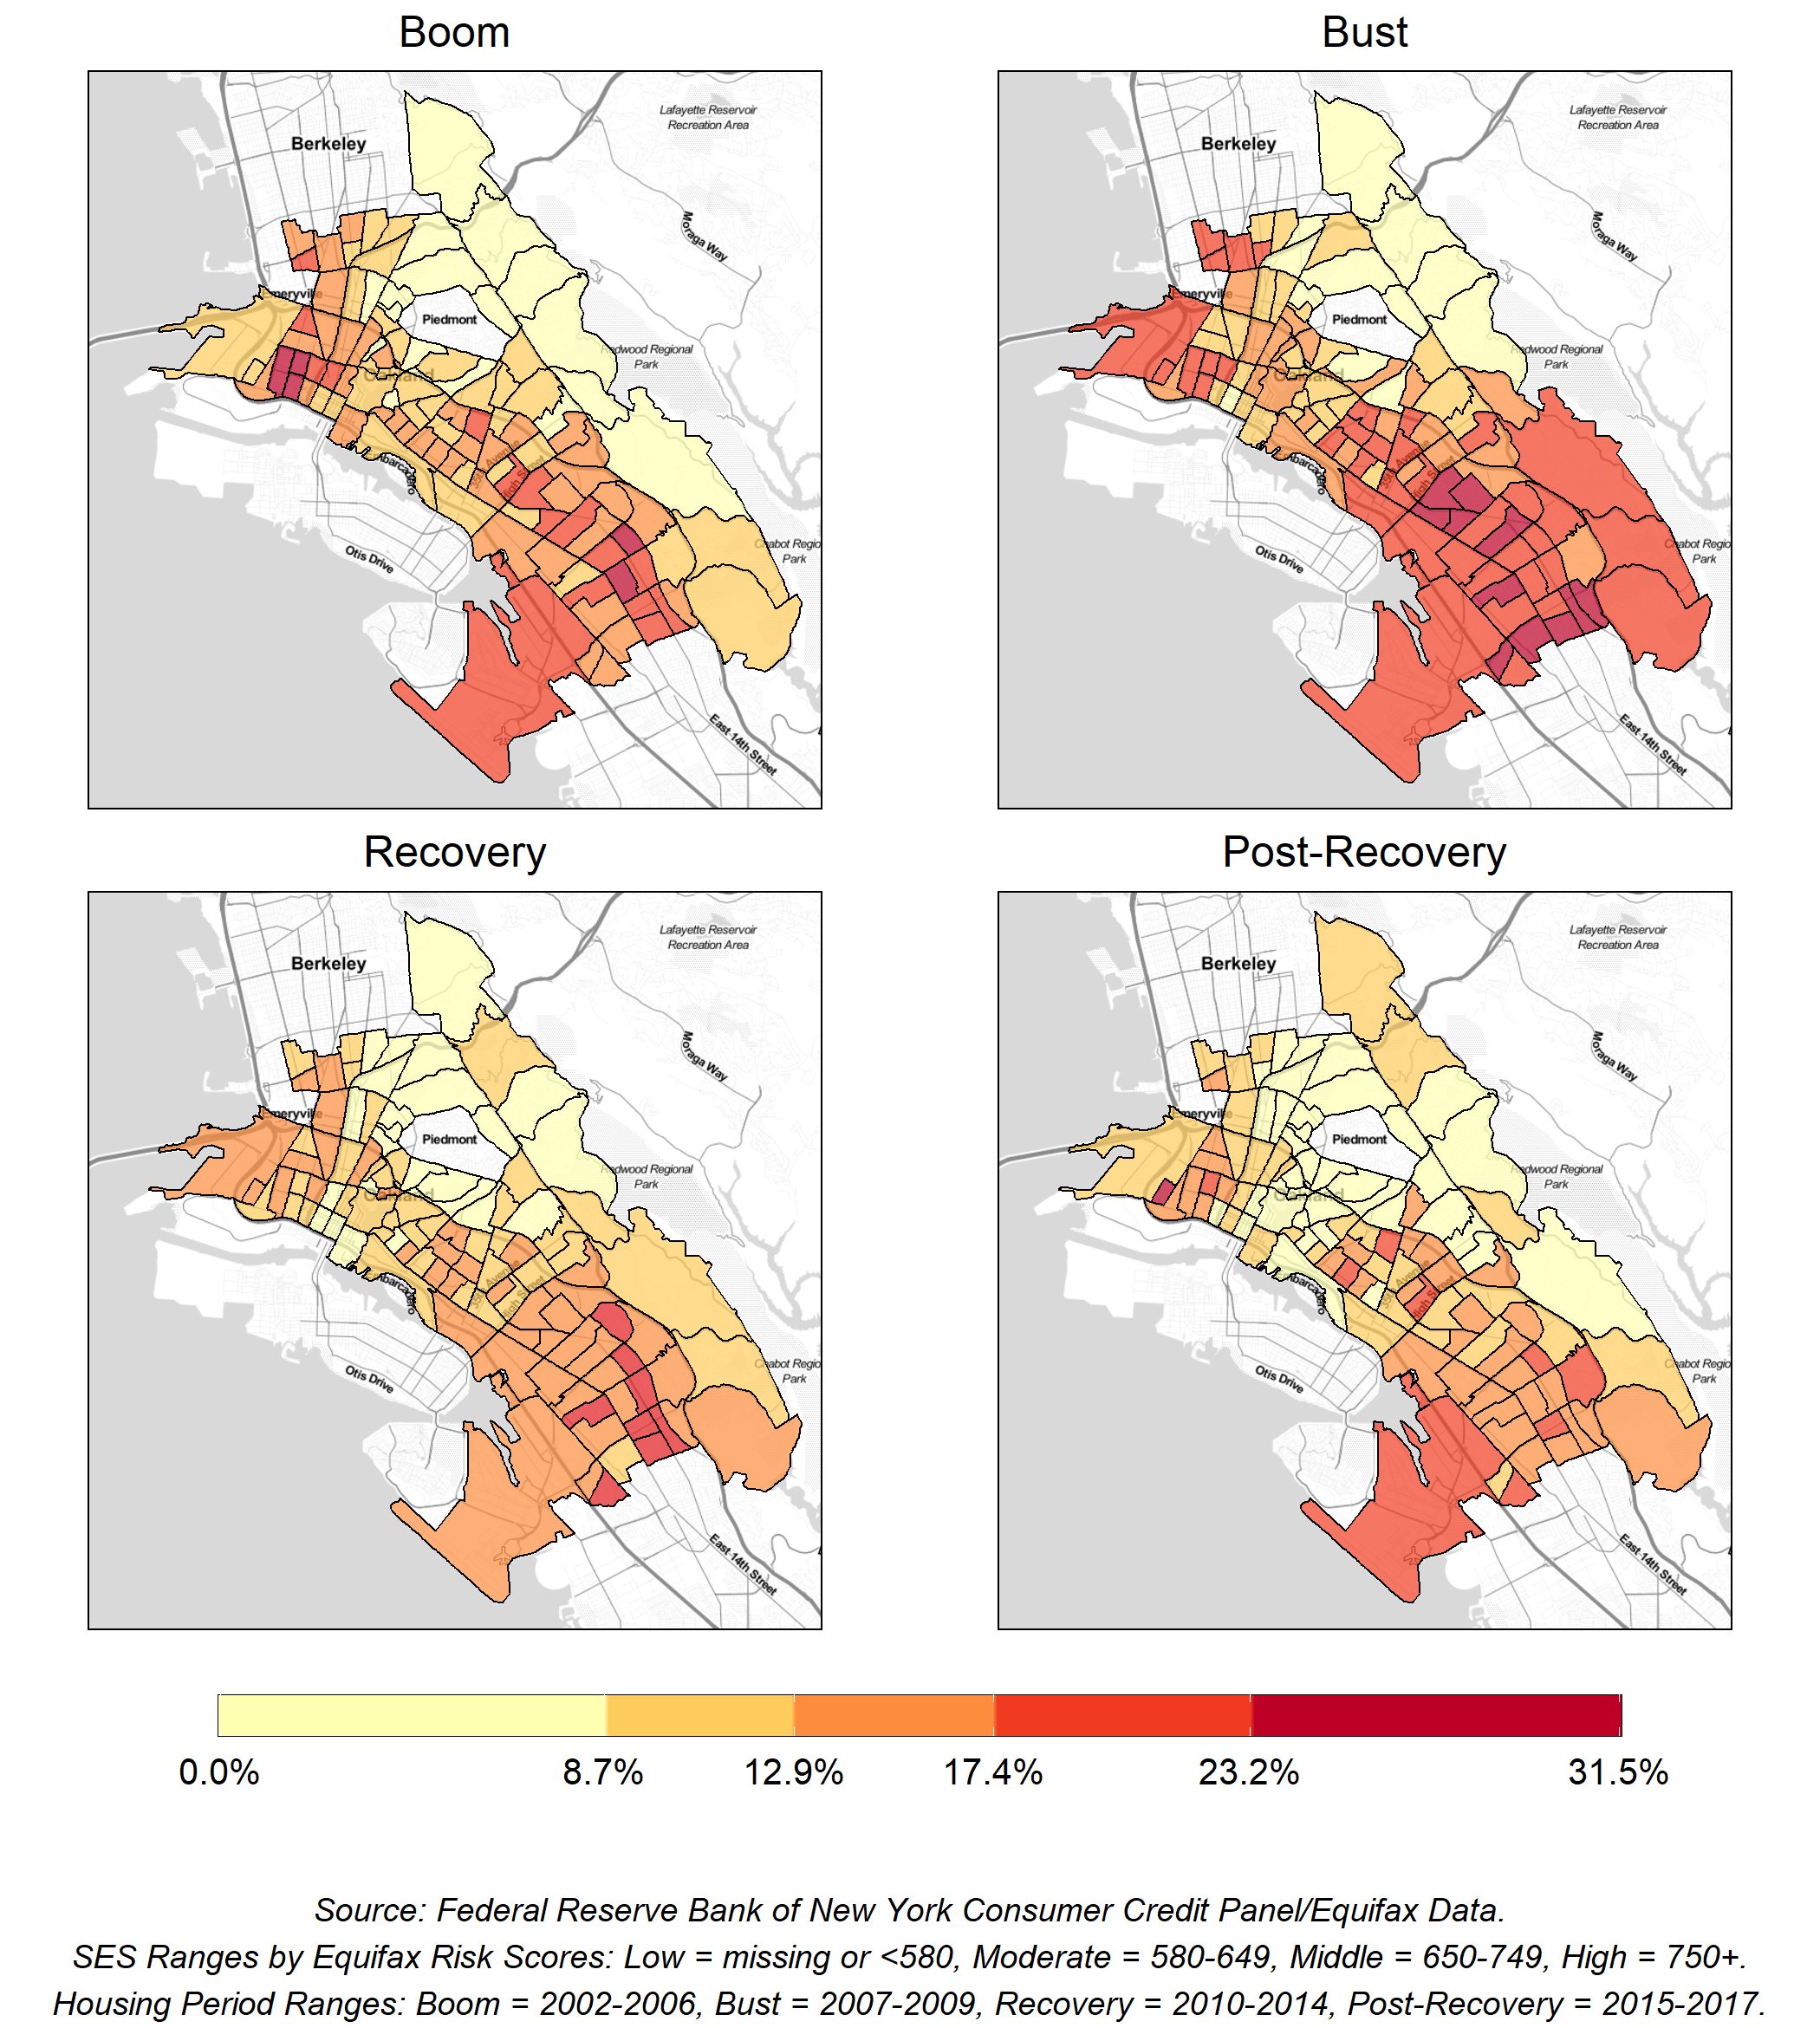
In the post-recovery period, an equal share of neighborhoods experienced decreases and increases in the shares of low-SES residents. Areas with increases in the proportion of low-SES residents during this period—parts of East Oakland and Downtown Oakland—also had greater shares of new delinquencies (Figure 4). Together, these maps highlight the areas where there is increasing financial instability. Shifts in the share of residents in moderate-, middle-, and high-SES categories that became low-SES by the end of the year (not shown) yield similar trends to the spatial distribution of new delinquencies.
Parts of East Oakland and Downtown Oakland had increases in shares of low-SES residents and greater shares of new delinquencies during the post-recovery period.
Figure 4 a: Change in Low-SES Percentage, by Housing Period
Figure 4 b: Percentage of New Delinquencies Low-, Moderate-, and Middle-SES Residents, by Housing Period
Foreclosure and vacancy rates were highest in Deep East Oakland and parts of West Oakland (not shown). Although lower-SES residents moved to fewer places over time, they increasingly concentrated in areas hit hard by the foreclosure crisis. Nonetheless, many of these areas started experiencing increases in households with mortgages and middle-SES residents during the post-recovery period, signaling gentrification.
To measure neighborhood (dis)investment, we drew on the number and value of building permits for new construction, rehabilitation, and major additions across Oakland neighborhoods. Building permits in Deep East Oakland and parts of West Oakland were consistently lower than other parts of the city (Figure 5). However, during the post-recovery period, the area in West Oakland adjacent to the Bay Bridge had high rates of properties with permits, as well as other areas throughout the rest of Oakland. Similarly, the value of building permits in Deep East Oakland and West Oakland were lower than other areas. During the post-recovery period, this value was also high in West and North Oakland.
Disinvestment Remains Concentrated in Deep East Oakland and Parts of West Oakland
Figure 5: Maps of Average Annual Rates of Number of Addresses with Large Building Permits, by Period
Policy Implications
West Oakland and parts of North Oakland and Downtown Oakland are the most impacted by gentrification. At the same time, lower-SES residents in these neighborhoods with increased gentrification are both moving out and shifting to crowded households more. Parts of East Oakland and Downtown Oakland are experiencing rising financial instability, while Deep East Oakland and pockets of West Oakland with long histories of disinvestment continue to experience disinvestment. It is therefore crucial to not only monitor these distinct areas for displacement and disinvestment, especially in the wake of the pandemic, but to also focus on these areas when developing strategies to support residents who resort to crowded households and experience greater financial instability to avoid moving.
1 Using the following working definition of gentrification — the socioeconomic upgrading of low-income urban neighborhoods characterized by reinvestment, renewal, and the influx of higher-socioeconomic-status residents – we build on past approaches to measuring gentrification and distinguish between different paces of change. Based on our work on gentrification and displacement in the Bay Area, we employ the following categories for changes from 2000 to 2016: Nongentrifiable (high income in 2000), Intense, Moderate, Weak, People, Price, and Nongentrifying (no substantial increases in housing prices or high-socioeconomic-status residents).
This is the fourth post in our series of Data Vignettes on Residential Instability in Oakland.


