

Oakland Vignette Series: Moderate-SES Residents are More Vulnerable to Residential Instability
Changing Cities Research Lab
Contributors: Jackelyn Hwang, Vineet Gupta, Becky Liang, Alisha Zhao, and Vasudha Kumar
September 7, 2021
This is the third post in our series of Data Vignettes on Residential Instability in Oakland. Navigate to other posts in this series here.
Our previous post covered findings from our report showing the increased constraints low-socioeconomic status (SES) residents faced after the Great Recession, as they moved less overall but increasingly moved to crowded households and experienced financial instability. We also discussed changes in financial security that Oaklanders in other SES groups experienced during the Recession and after the housing market recovered from the Recession. Our first post of the series noted the high rates of moving by moderate- and middle-SES residents throughout most of the last two decades, including during the COVID-19 pandemic. In this post, we expand on the vulnerability of moderate-SES residents to residential instability as the housing crisis continues. Moderate-SES residents have moved into lower-opportunity neighborhoods and crowded households more than low- and higher-SES residents in recent years.
In our report , SES categories are based on Equifax Risk Scores, a type of credit score that ranges from 280 to 850 and approximates financial stability rather than income or wealth. Low-SES refers to a score less than 580 or no score, moderate-SES refers to a score between 580 and 649, middle-SES refers to a score between 650 and 749, and high-SES refers to a score at 750 or greater.
Moderate-SES Residents are Moving Out More and Moving Into Oakland Less
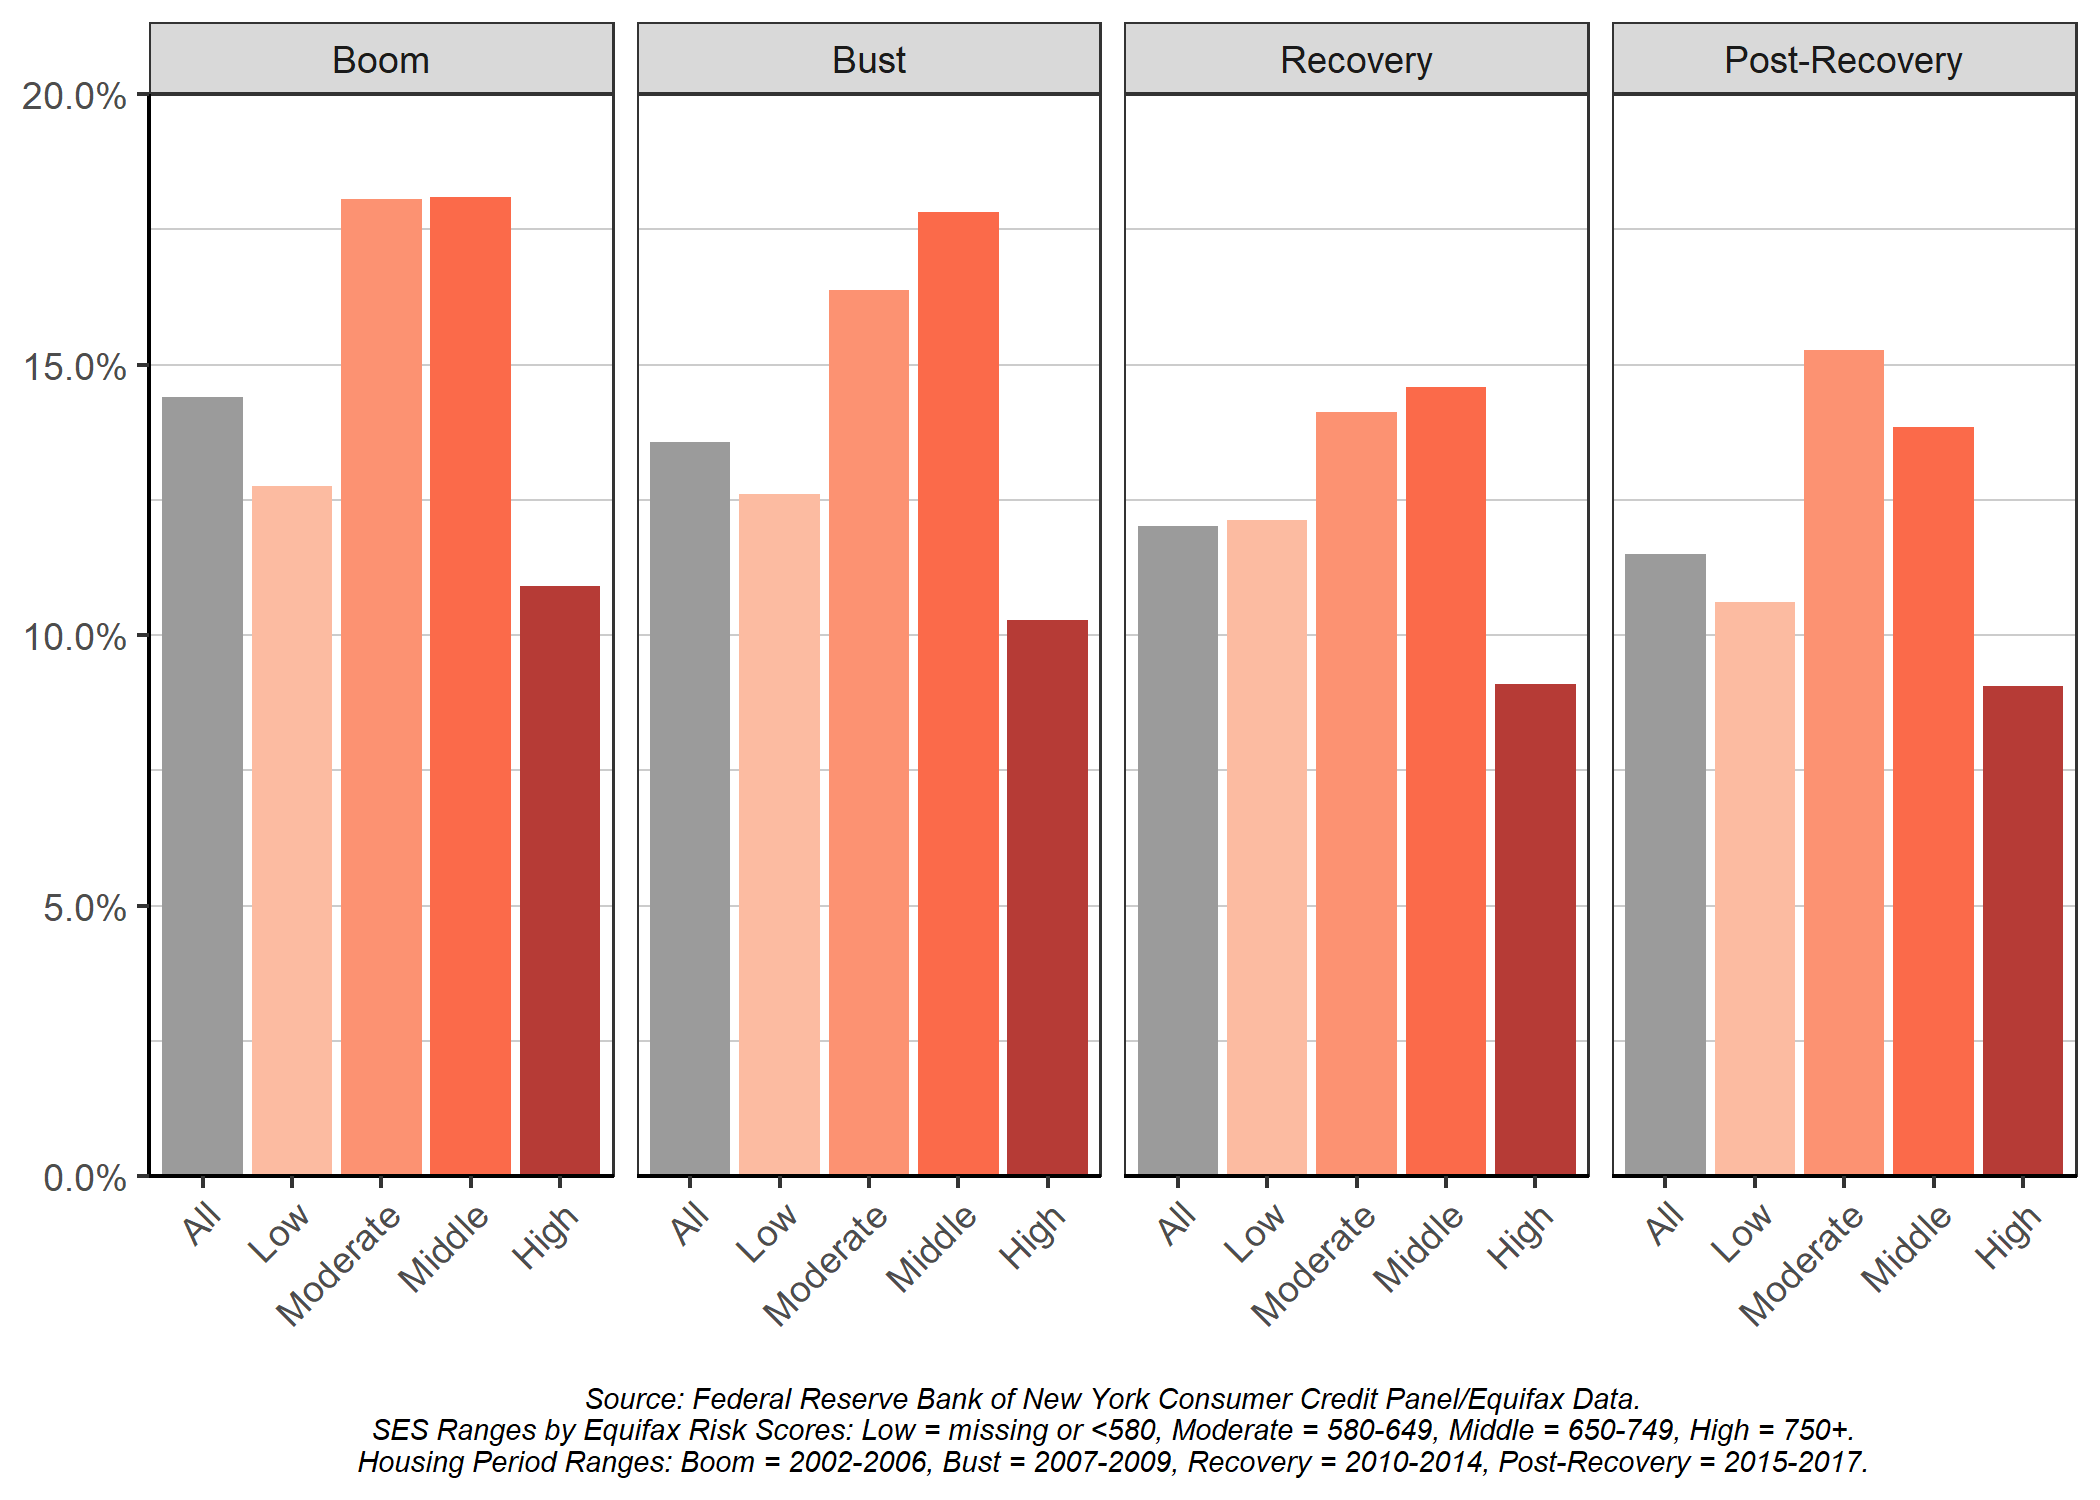
Moderate-SES residents moved the most in the post-recovery period after the Great Recession, while other SES groups moved less.
Figure 1: Percent of Oakland Residents Who Moved from 2002-2018, by SES and Housing Period.
Moderate-SES residents consistently moved at or above national rates in all housing periods from before to after the Great Recession (Figure 1). After the housing market recovered from the Great Recession in 2015 (post-recovery period), moderate-SES residents moved more, while all other SES groups moved less. In addition, moderate-SES residents moved at among the highest rates across all SES groups in all housing periods2.
Moderate-SES residents are also moving more during the COVID-19 pandemic than before and are continuing to move above overall rates (Figure 2). They exhibited slight increases in their moving rates in general, as well as in rates of moves out of Oakland and the Bay Area.
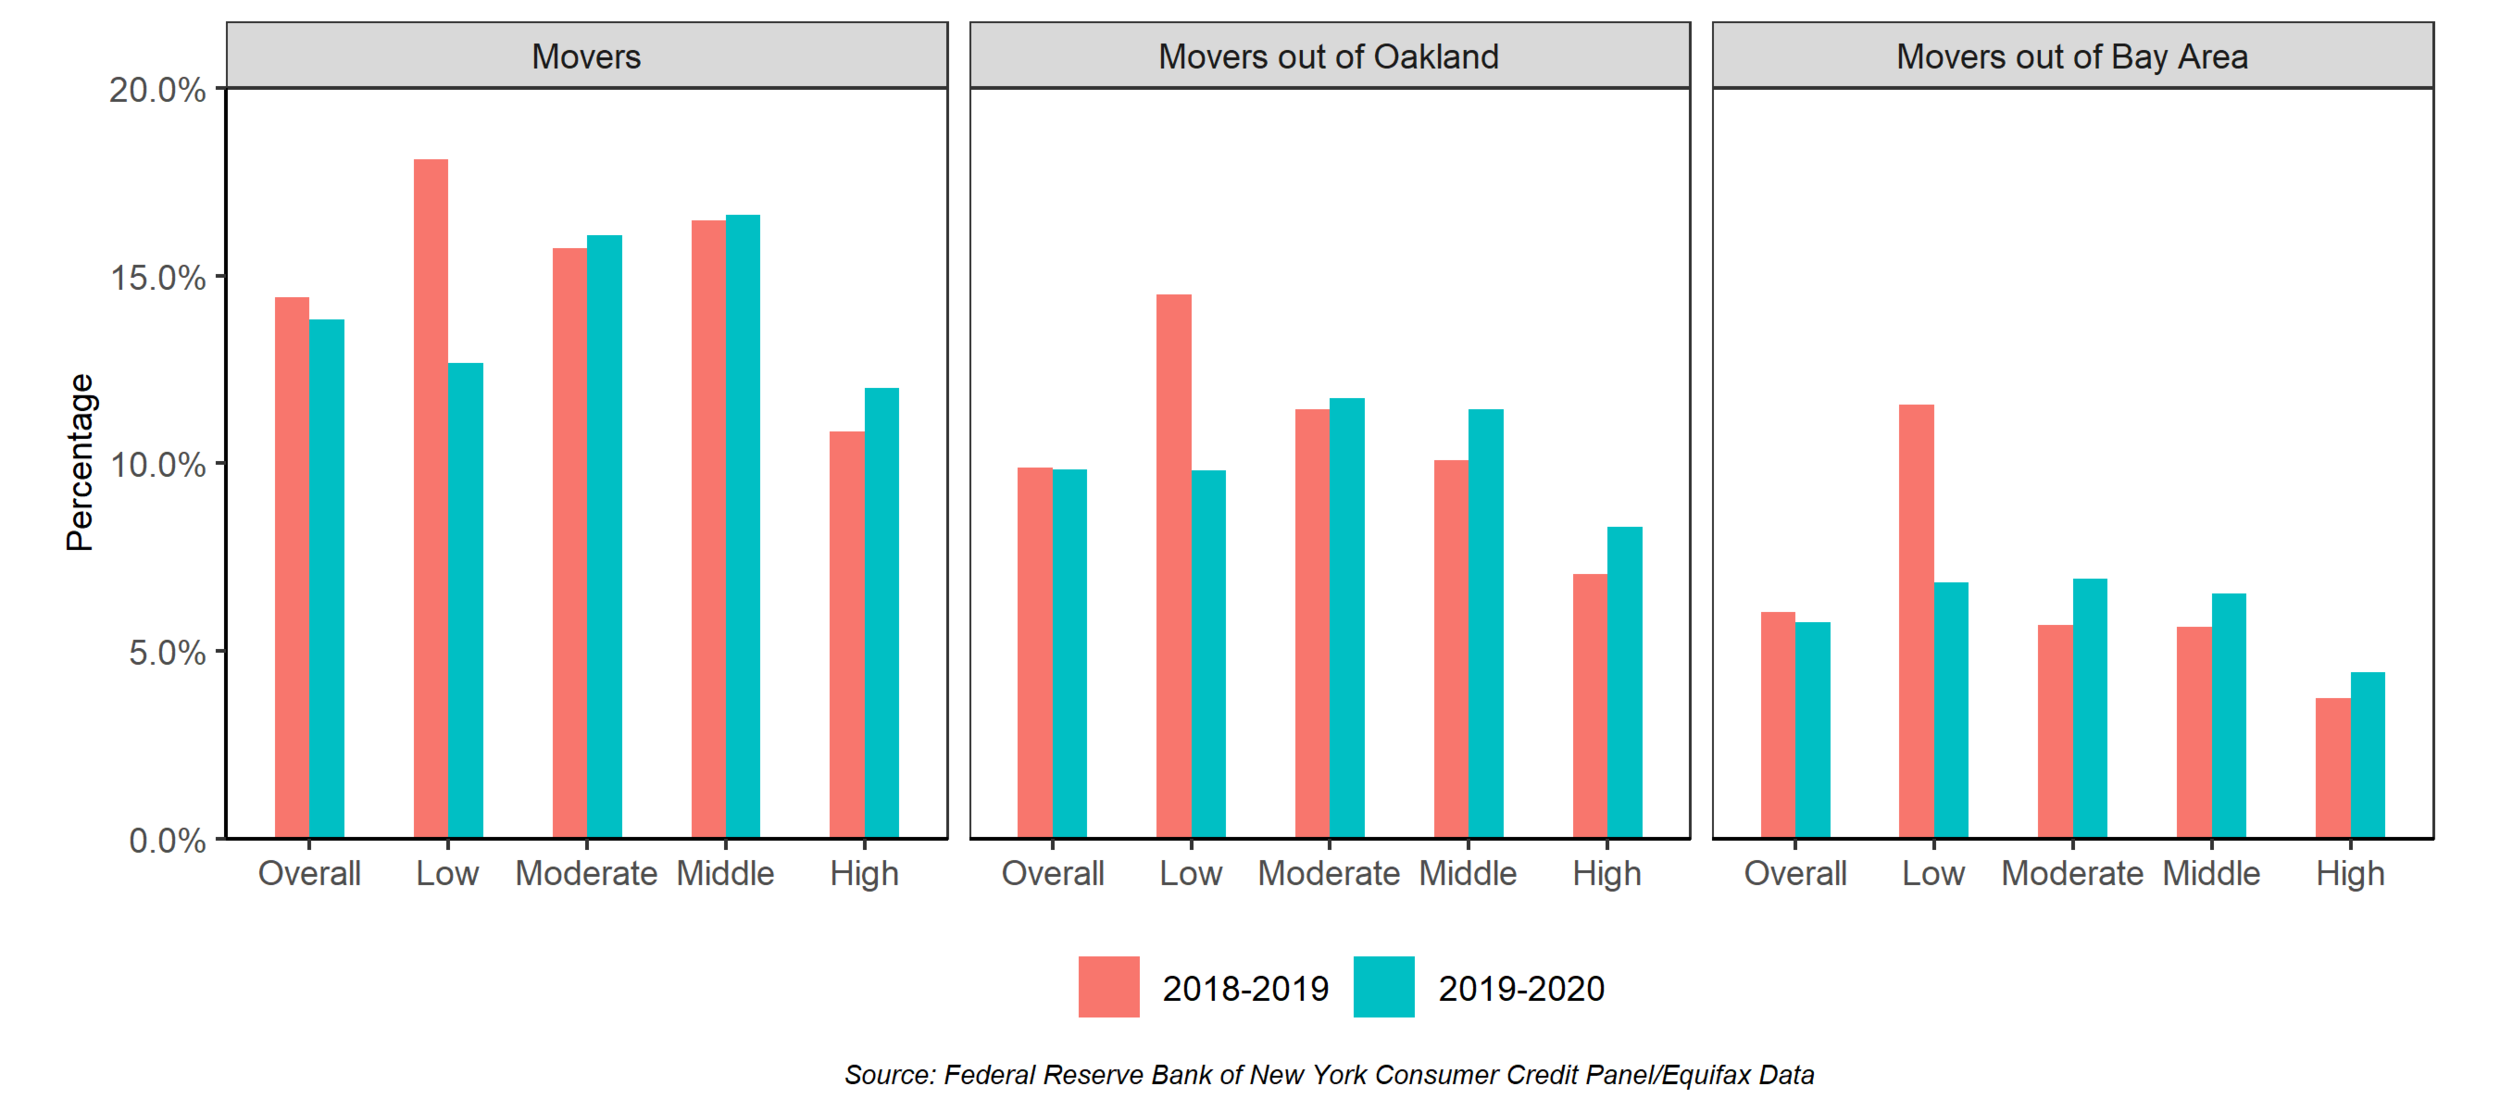
Moderate-SES residents moved more during the COVID-19 pandemic.
Figure 2: Percent of Residents Moving, Moving Out of Oakland, and Moving Out of the Bay Area from September 2018 - September 2020, by SES.
Despite having higher moving rates, moderate-SES residents moved into Oakland less than other SES groups during all housing periods except the recovery period after the Great Recession, when housing was likely more accessible to these groups (Figure 3). Further, the percentage of moderate-SES residents in Oakland neighborhoods declined substantially during the post-recovery period, reflecting greater displacement—either directly or indirectly—of this SES group, compared with others. Over time, moderate-SES residents moved into Oakland the least out of other groups and moved to fewer places, concentrating in areas hit hard by foreclosures and continued disinvestment.
For most periods, more moderate-SES residents moved into parts of East Oakland and North Oakland, but they moved to far fewer places in the post-recovery period, as far fewer moved into Oakland. Overall, these trends suggest that many parts of Oakland became less accessible to moderate-SES residents over time, reflecting the increasingly limited housing options for lower-SES movers in Oakland.
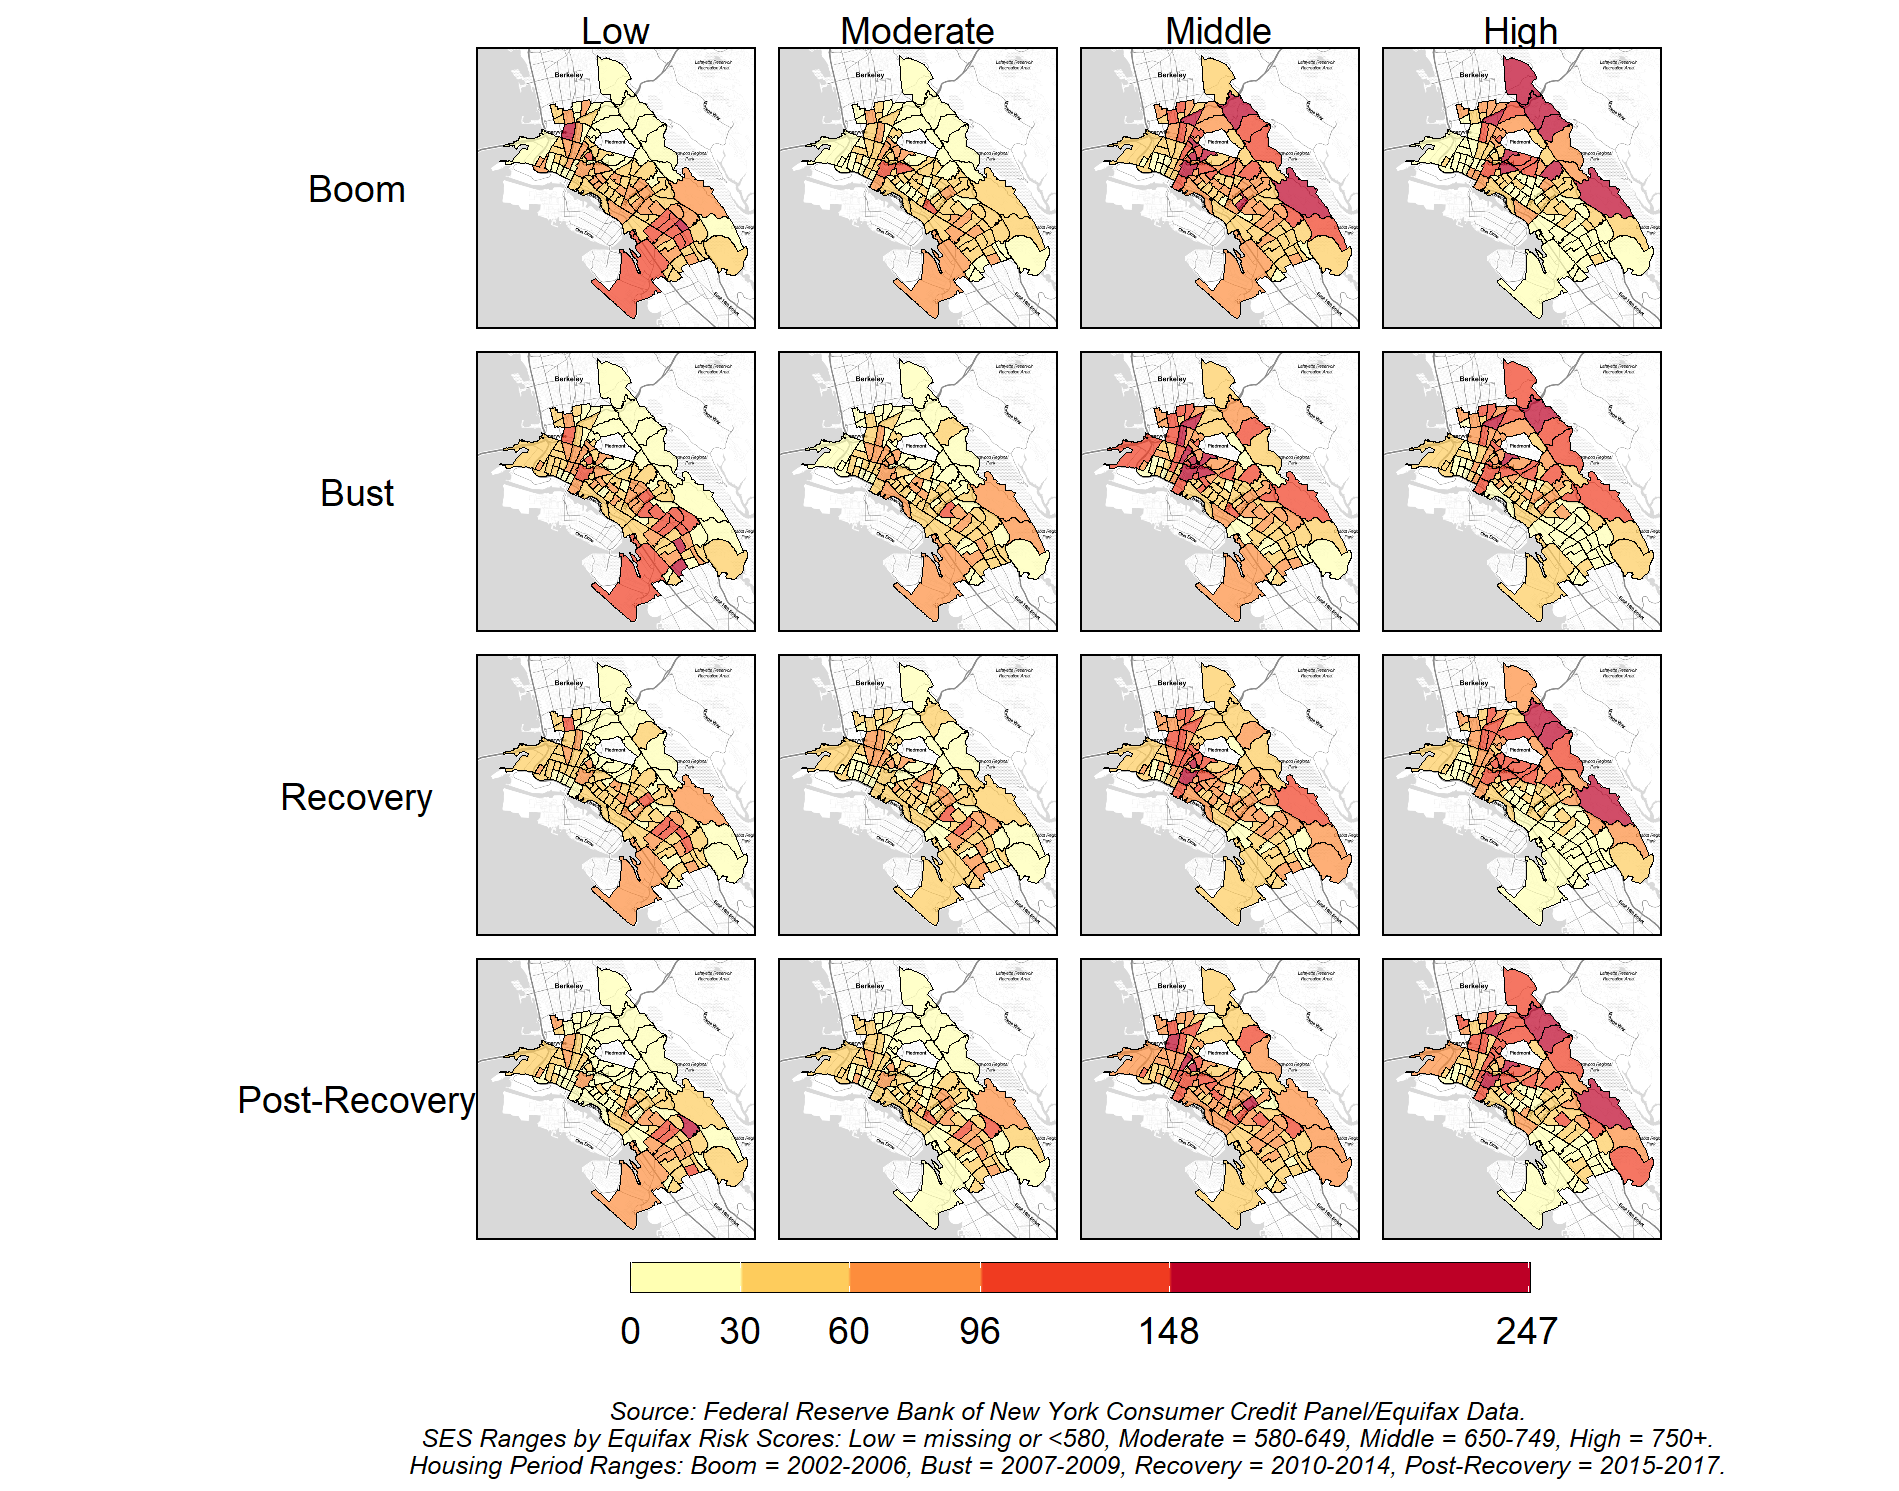
Moderate-SES residents moved into Oakland at lower rates than other SES groups.
Figure 3: Maps of Destinations for People Who Move into Oakland per Year, by SES and Housing Period.
Moderate-SES Residents are Increasingly Making Downward Moves
The share of residents moving to lower-opportunity neighborhoods has declined over time since the housing bust, but this share is highest for moderate-SES residents compared to low- and high-SES residents in the post-recovery period. These trends are consistent with the overall moving rates.
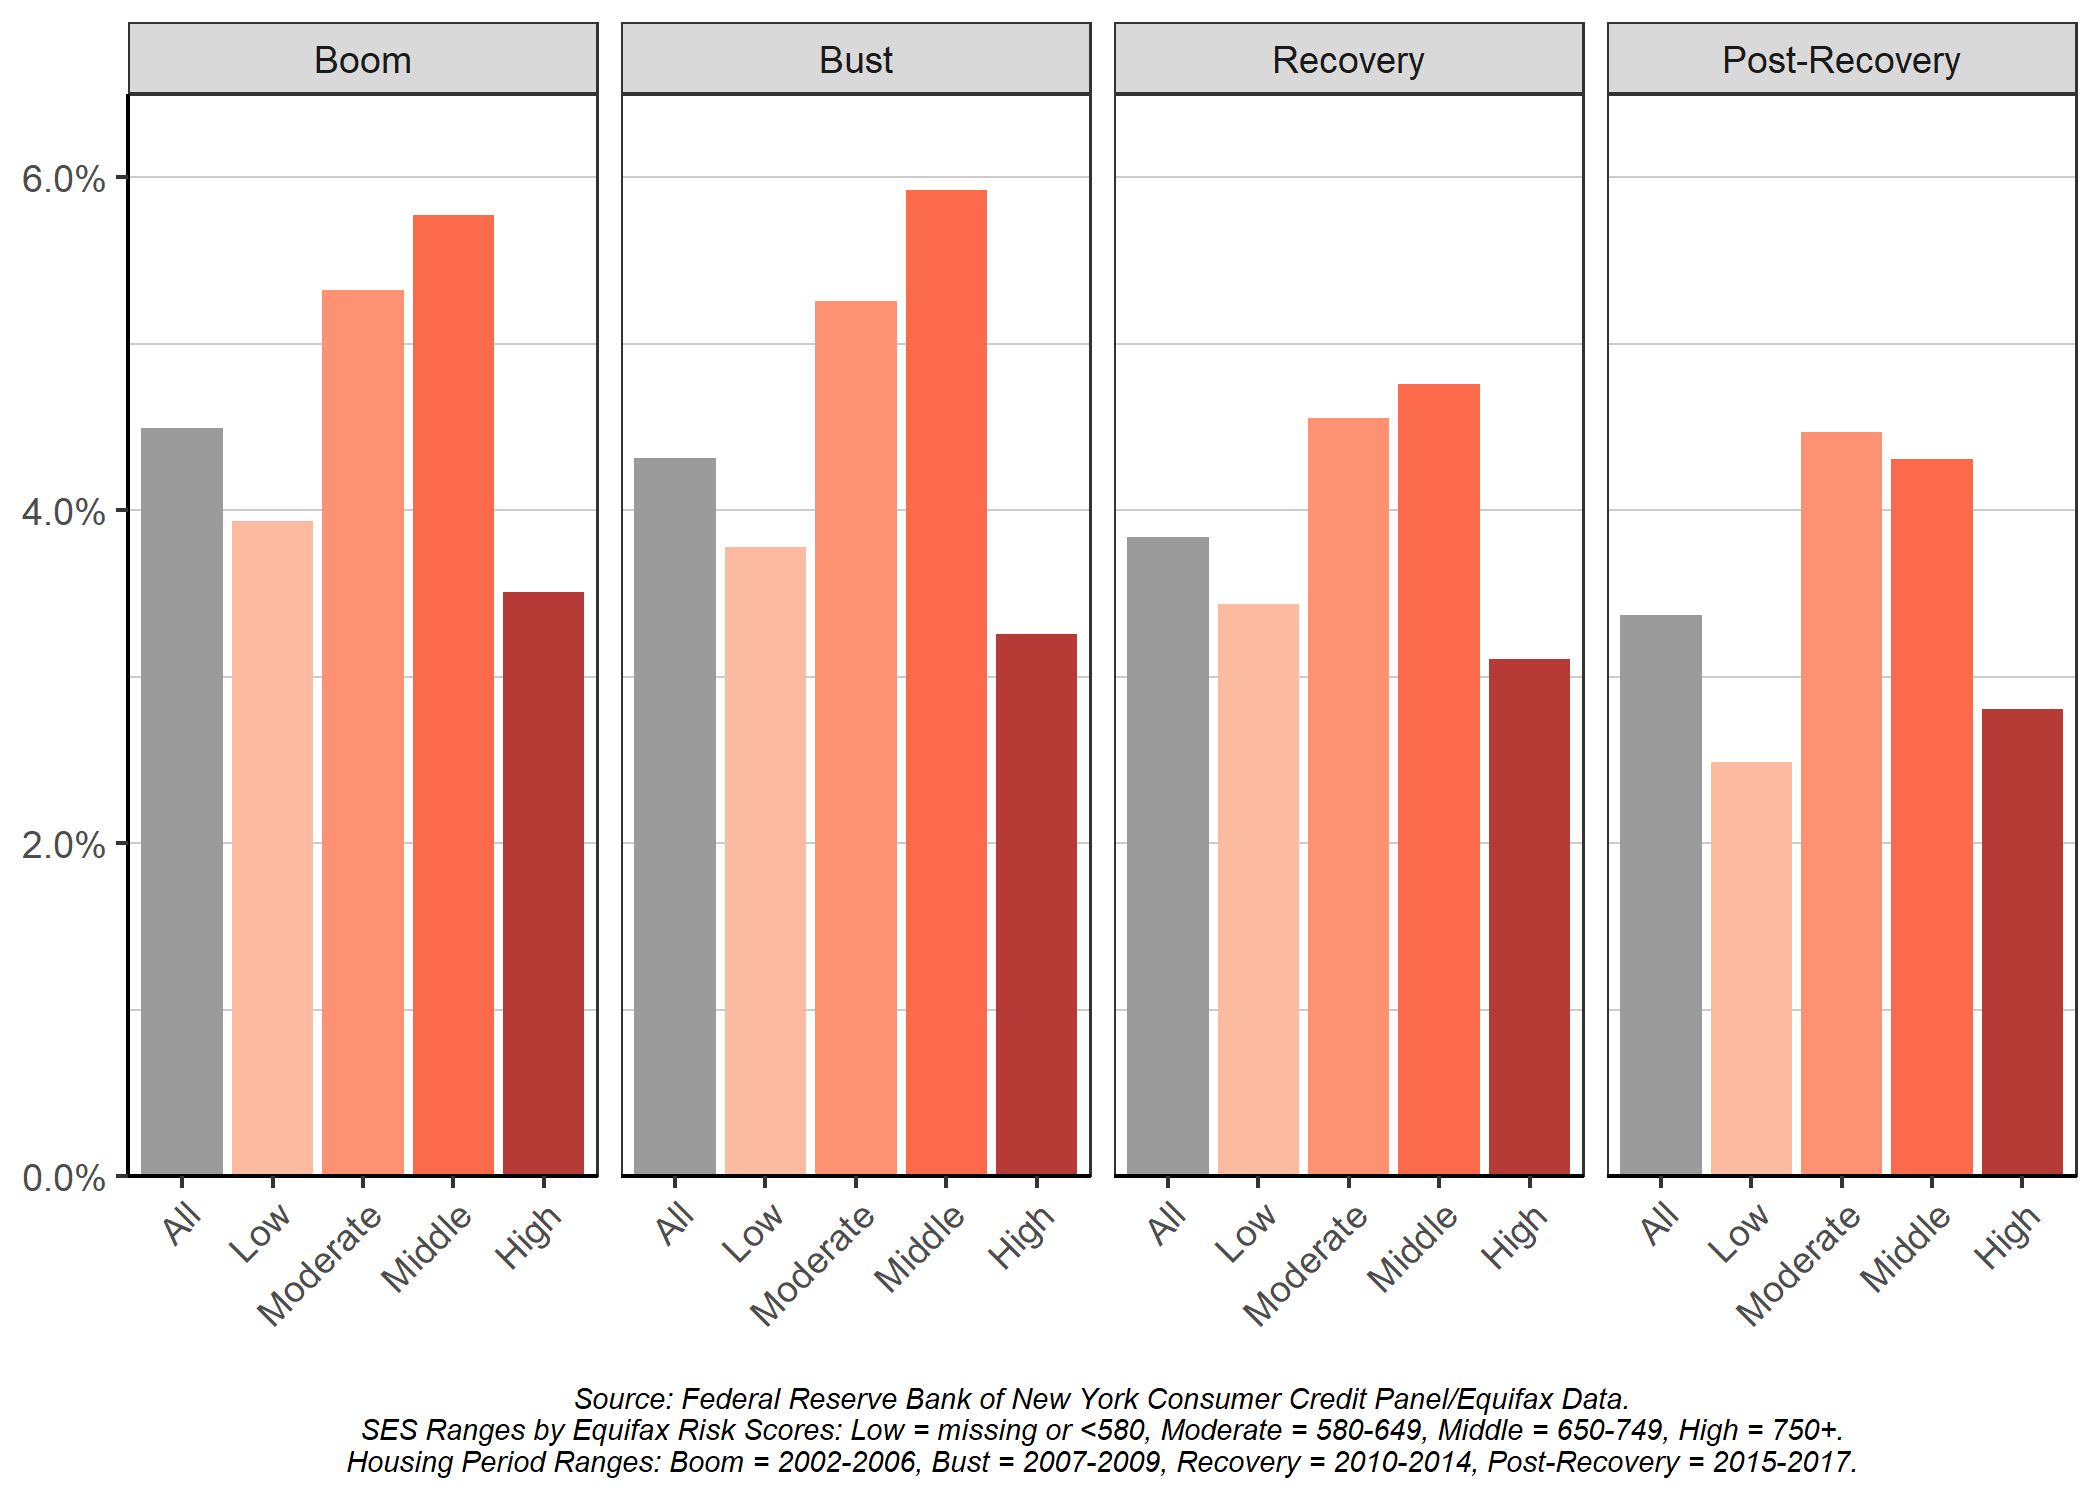
Moderate-SES residents consistently moved to lower-opportunity neighborhoods more than other SES groups.
Figure 4: Percentage of Oakland Residents Who Move to Neighborhoods with Lower Healthy Places Index Scores, by SES and Housing Period.
A greater percentage of moderate-SES residents moved to neighborhoods with lower Healthy Places Index Scores than low- and higher-SES residents in the post-recovery period, as well as most housing periods (Figure 4). These trends are similar to the share of residents who moved to neighborhoods with higher poverty rates and lower median home values (not shown). The share of moderate-SES residents making downward moves during the post-recovery period in both of these cases is greater than the share of other SES groups as well as the overall percentage of downward moves.
Moderate-SES residents moved to neighborhoods with higher poverty rates over time, which reflects the increasingly constrained choices that moderate-SES movers faced as affordability became even more constrained. These outcomes indicate that moderate-SES residents have consistently experienced downward displacement since the Great Recession by moving to lower-opportunity neighborhoods.
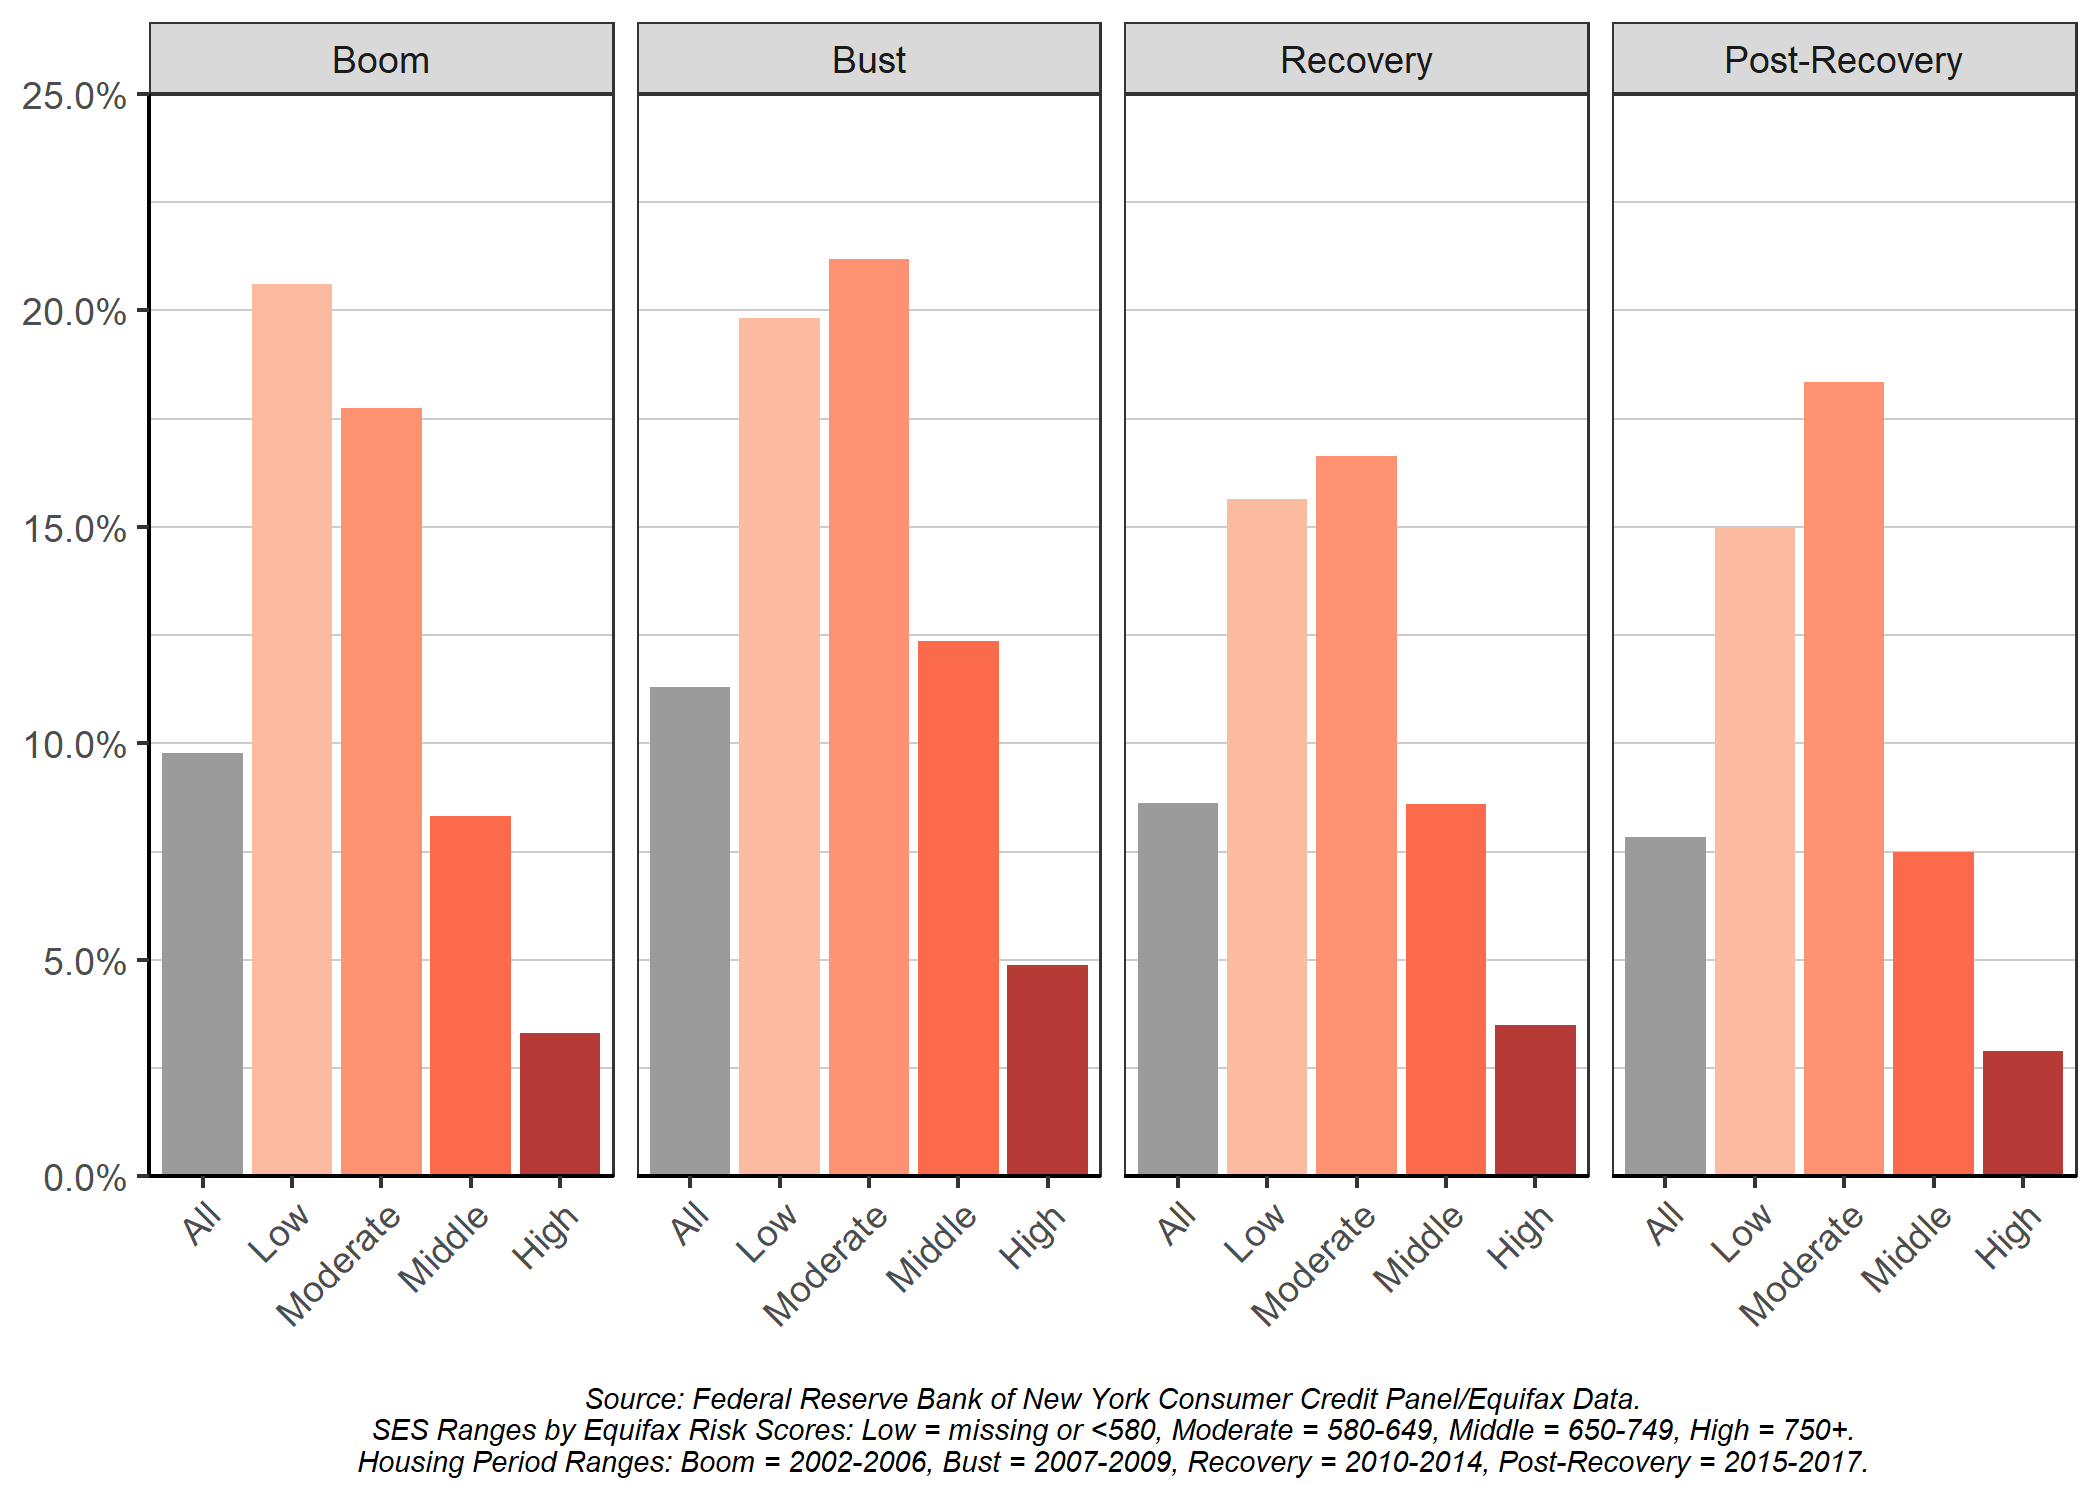
Moderate-SES Residents are Increasingly Moving into Crowded Households
In addition to moving, the extent to which residents live and move into more crowded households can shed light on the types of residents who experience housing constraints. Moderate-SES residents, who moved more often than other groups, also shifted more often from low-density to high-density households across all housing periods, which may reflect efforts to reduce housing costs (Figure 5). The prevalence of these kinds of moves increased over time, suggesting that declining affordability is pushing residents into crowded living situations.
During the post-recovery period, moderate-SES residents increasingly made shifts to crowded households, shifting at the highest rates across all SES groups. In contrast, other SES groups experienced a decrease in shifts to crowded households in the same period.
Moderate-SES residents moved to crowded housing more than other SES groups during the post-recovery period.
Figure 5: Percentage of Oakland Residents Who Moved from Households with 1-2 Adults to a Household with 4+ Adults, by SES and Housing Period.
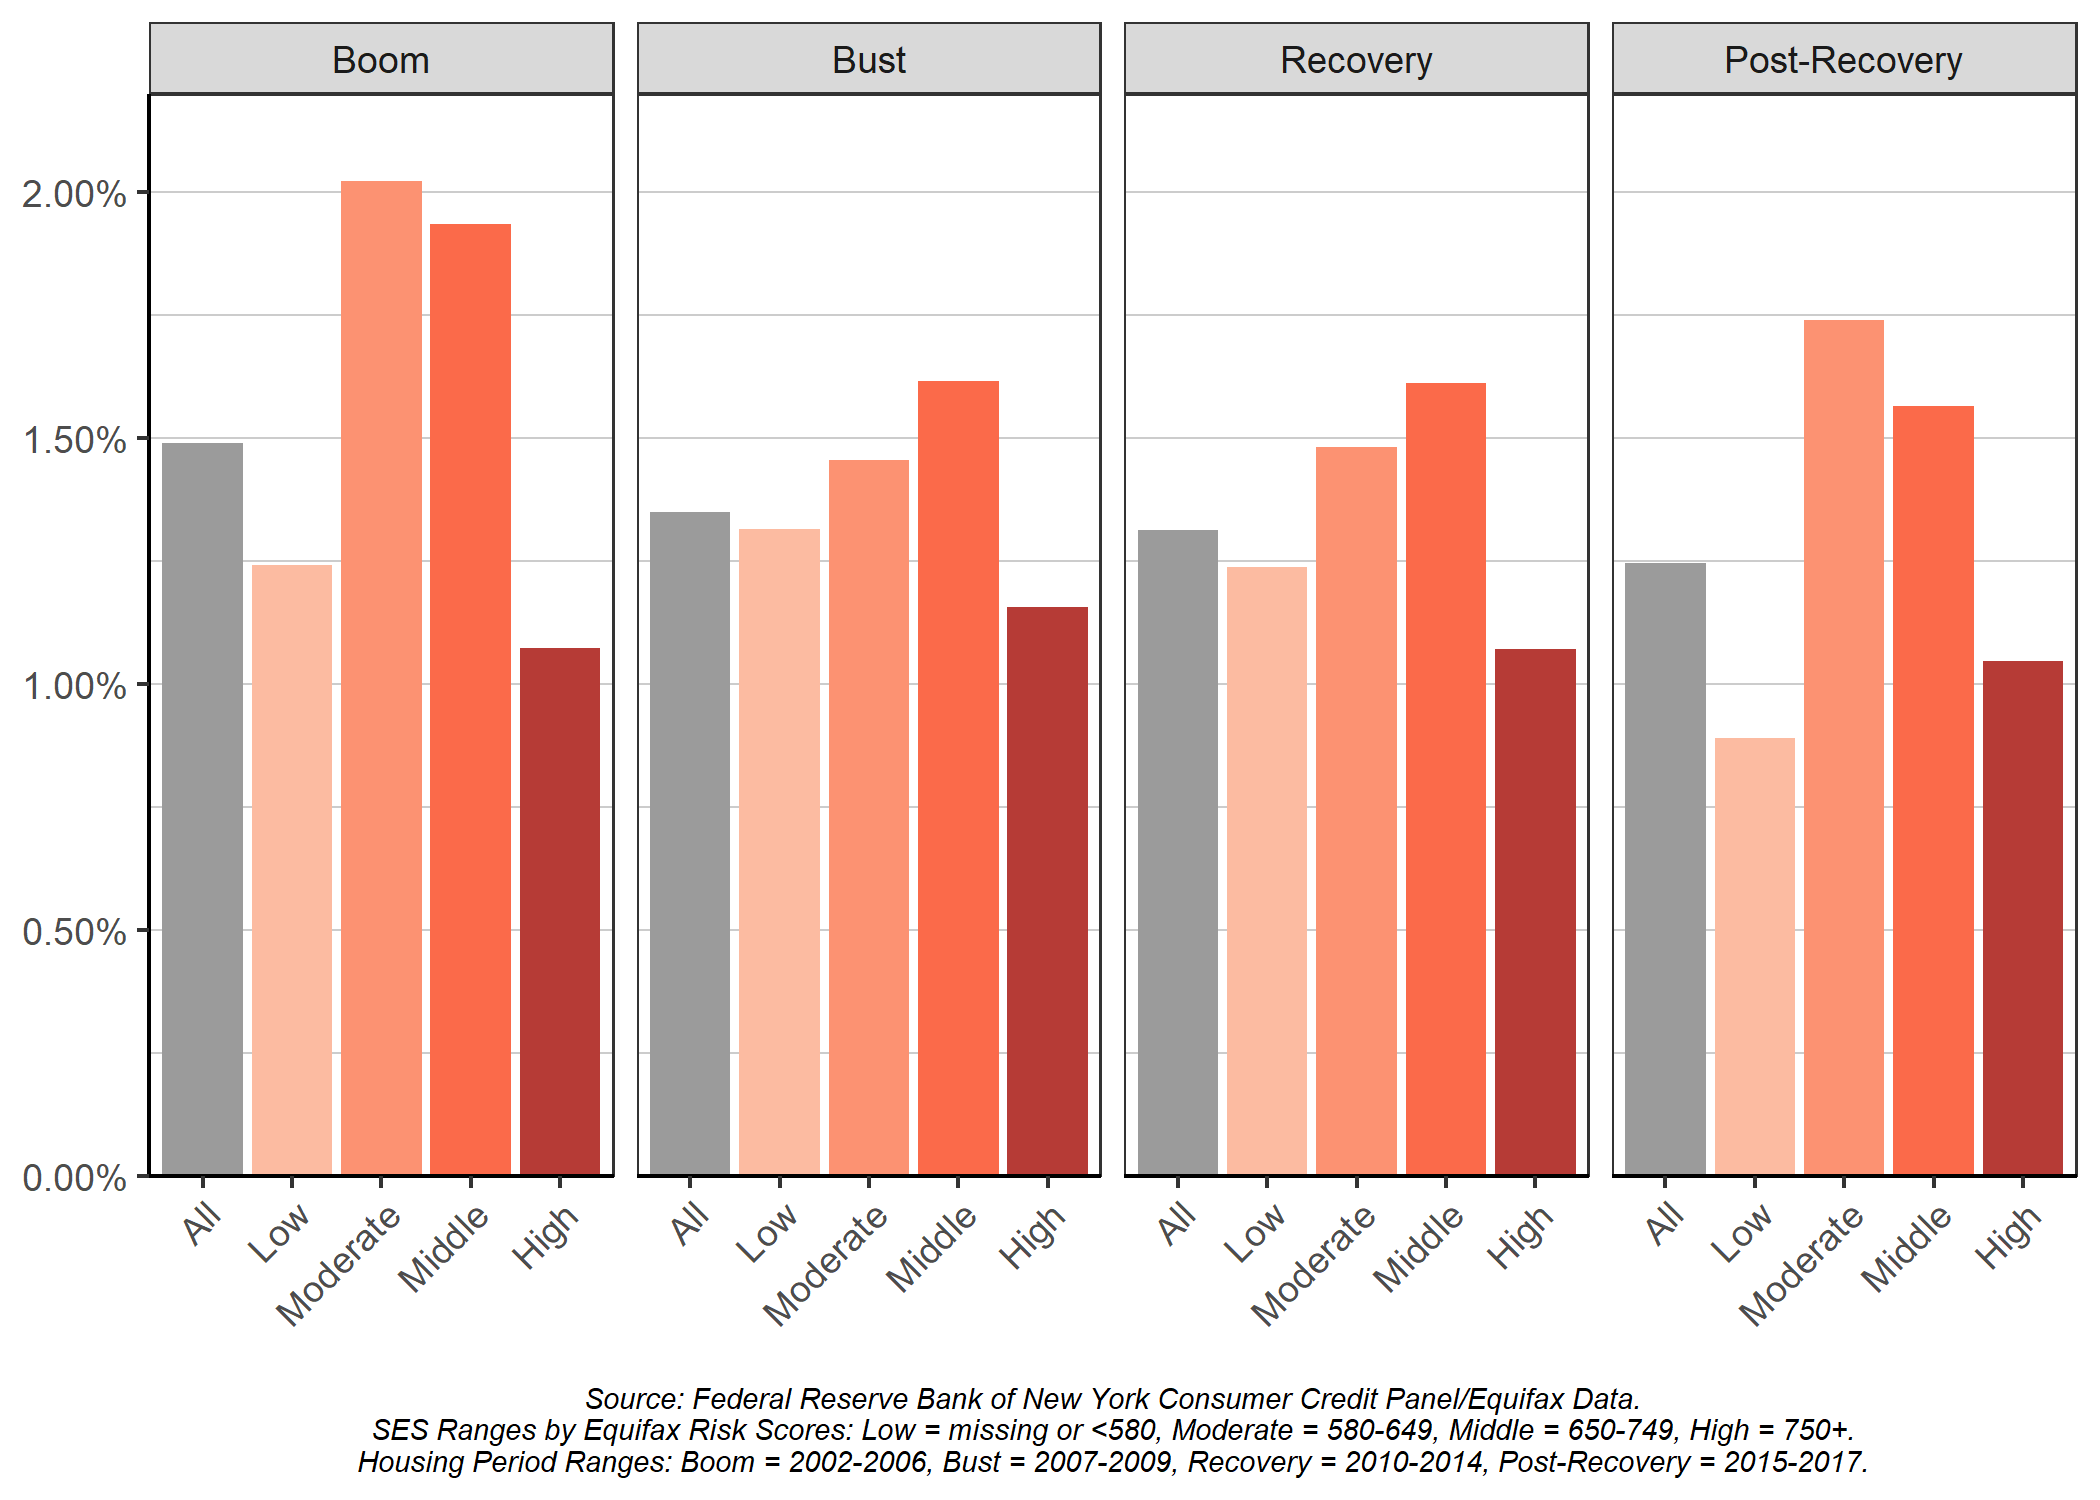
Moderate-SES Residents are Experiencing More Financial Instability
Measures of financial instability can also speak to the level of residential instability residents are facing. To assess whether these shifts reflect changes in individuals’ financial stability, we examine the extent to which residents lived in households without any delinquencies where someone became delinquent on any credit account over each year, which we refer to as a new delinquency.
While other SES groups experienced a decrease in the percentage of households with new delinquencies during the post-recovery period, moderate-SES residents experienced an increase in new delinquencies (Figure 6). This finding suggests that moderate-SES residents in Oakland may be experiencing more financial instability as affordable housing has become increasingly limited.
Moderate-SES residents experienced an increase in new delinquencies after the housing market recovered, while all other SES groups experienced decreases.
Figure 6: Percentage of Oakland Residents with New Delinquencies, by SES and Housing Period.
Policy Implications
Although displacement protections are often geared toward low-SES residents, moderate-SES residents are also considerably disadvantaged in the housing market and make downward moves at among the highest rates. Moderate-SES residents may not be eligible for these resources and services that primarily support low-SES residents’ housing stability. As such, moderate-SES residents may be more susceptible to the effects of gentrification and impacts on the private housing market.
Especially since the COVID-19 pandemic began, moderate-SES residents have increasingly moved, shifted to crowded living situations, and experienced declines in their credit. In addition, more moderate-SES residents have become low-SES residents, compared with before the pandemic. Overall, this suggests that moderate-SES residents may be a relatively neglected population that have experienced widespread displacement and other forms of instability and will continue to do so. These trends indicate a pressing need for expanding displacement protections for moderate-SES residents to prevent further displacement.
1 Because we do not have information on household size (including children) and the CCP data is a sample of individuals, not households, our data are not directly comparable to the U.S. Department of Housing and Urban Development (HUD) Area Median Income (AMI) categorizations, which are based on metropolitan area, family size, and income. Analysis of population distributions using data from the Comprehensive Housing Affordability Strategy (CHAS) for the City of Oakland suggest that our SES categories are similar to the following HUD AMI categories, respectively: <30% data-preserve-html-node="true" AMI (“extremely low”, as labeled by the State of California), between 30% and 50% AMI (“very low”), between 50% and 100% AMI (“low” and “moderate” ), and above 100% AMI (“high”).
2 Boom (2002-2006), Bust (2007-2009), Recovery (2010-2014), Post-Recovery (2015-2017)
This is the third post in our series of Data Vignettes on Residential Instability in Oakland. Navigate to other posts in this series here.